Summary: A scatter diagram, or scatter plot, is a statistical tool used to visualize the relationship between two numerical variables. By plotting data points on an XY graph, it helps identify trends, correlations, and outliers. Scatter diagrams are widely used in business, science, and education for effective Data Analysis.
Introduction to Scatter Diagrams
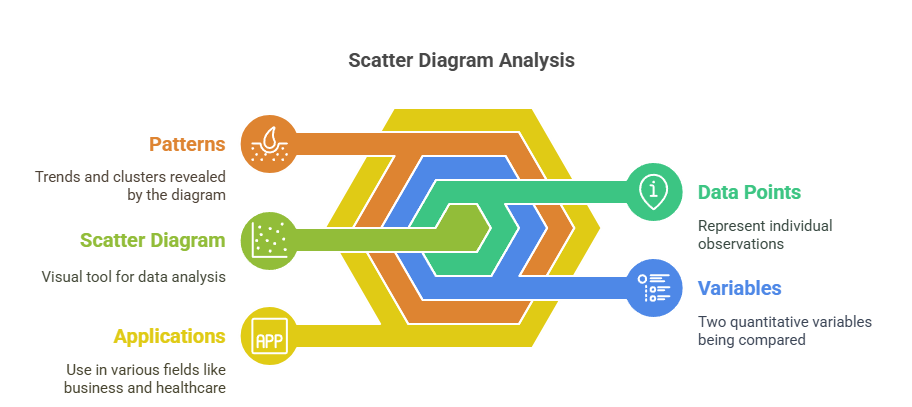
A scatter diagram-also known as a scatter plot, scatter graph, or XY graph-is one of the most fundamental and visually intuitive tools in statistics and Data Analysis. It is a two-dimensional chart that displays the relationship between two quantitative variables by plotting data points as dots on a Cartesian coordinate system.
Each dot on a scatter diagram represents a single observation, with its position determined by the values of the two variables being compared.
The power of a scatter diagram lies in its ability to visually reveal patterns, trends, clusters, and potential outliers within a dataset. Unlike tables of numbers or summary statistics, a scatter diagram provides an immediate snapshot of how variables interact.
This makes it indispensable not only for statisticians and data scientists, but also for professionals in business, healthcare, engineering, education, and numerous other fields.
For example, a business analyst might use a scatter diagram to examine whether increased advertising expenditure leads to higher sales revenue. In healthcare, a researcher might plot patient age against blood pressure to see if there is a relationship. In each case, the scatter diagram serves as a starting point for deeper analysis.
Key Takeaways
- Scatter diagrams plot two variables to show possible relationships.
- They help identify trends, correlations, and outliers in data.
- Useful across business, science, education, and quality control fields.
- Limited to showing association, not causation, between variables.
- Best for visualizing linear relationships; nonlinear patterns may require more analysis.
Purpose and Importance of a Scatter Diagram
The primary purpose of a scatter diagram is to visually assess the relationship between two numerical variables. This relationship could be positive, negative, or non-existent, and could be linear or nonlinear. By plotting data in this way, scatter diagrams help analysts answer critical questions such as:
- Do two variables move together, and if so, how?
- Is there a trend or pattern that warrants further investigation?
- Are there any unusual data points (outliers) that could skew results?
- Is the relationship strong enough to be useful for prediction?
Importance in Statistics
A scatter diagram is crucial in statistics as it visually displays relationships between two variables, helping identify correlations, trends, patterns, and outliers, and supporting data-driven analysis and decision-making
Detecting Correlation
Scatter diagrams are the first step in identifying whether a correlation exists between two variables. They help determine if the relationship is positive (both variables increase together), negative (one increases while the other decreases), or absent.
Identifying Outliers
Outliers-data points that deviate significantly from the general pattern-are easily visible in a scatter diagram. Spotting these early can prevent misleading conclusions.
Assessing Linearity
Scatter diagrams reveal whether the relationship is linear (points roughly form a straight line) or nonlinear (points form a curve or other pattern).
Supporting Hypotheses
Before conducting more complex statistical tests, scatter diagrams provide visual evidence to support or challenge hypotheses about variable relationships.
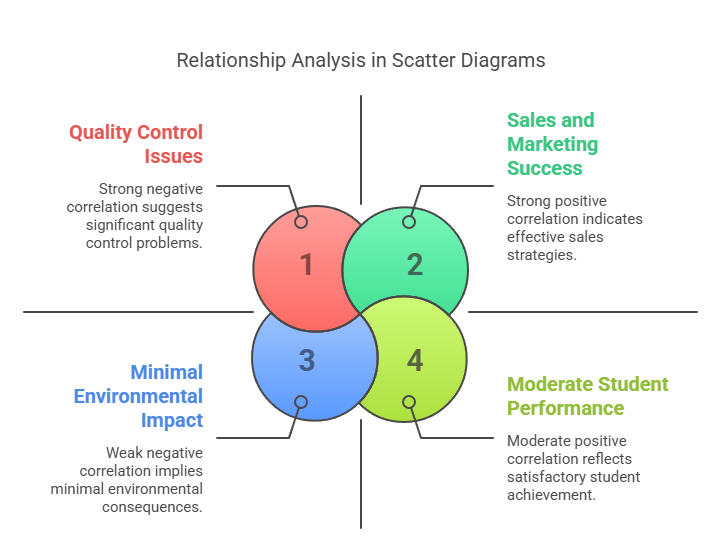
Quality Control
In manufacturing and process improvement, scatter diagrams are used to analyze the relationship between process inputs and outputs, helping teams identify root causes of defects and variability.
Components of a Scatter Diagram
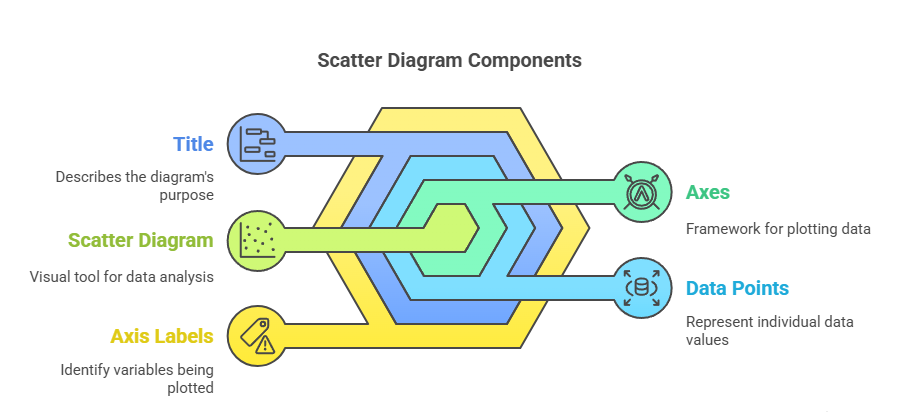
A well-constructed scatter diagram contains several key components. These components work together to make the scatter diagram a powerful and easy-to-interpret visualization tool.
Axes
The X-axis (horizontal) typically represents the independent variable, which is the variable you suspect is influencing the other.
The Y-axis (vertical) represents the dependent variable, which is the variable you believe is being influenced.
Data Points
Each pair of values from your dataset is plotted as a dot (or sometimes another symbol) on the graph. The position of each dot corresponds to the values of the two variables for that observation.
Title
A clear, descriptive title helps viewers immediately understand what relationship the scatter diagram is illustrating.
Axis Labels
Both axes should be labelled with the names and units of the variables being plotted, ensuring the diagram is self-explanatory.
Trend Line (Optional)
A trend line or line of best fit can be added to highlight the overall direction or pattern in the data. This is especially useful when the relationship is approximately linear.
Quadrants (Optional)
Sometimes, reference lines are drawn at the means of the variables, dividing the plot into quadrants. This can help in further analysis, such as identifying clusters or categories.
Legend (If Necessary)
If multiple groups or categories are plotted on the same scatter diagram, a legend is used to distinguish them.
Types of Relationships Seen in Scatter Plots
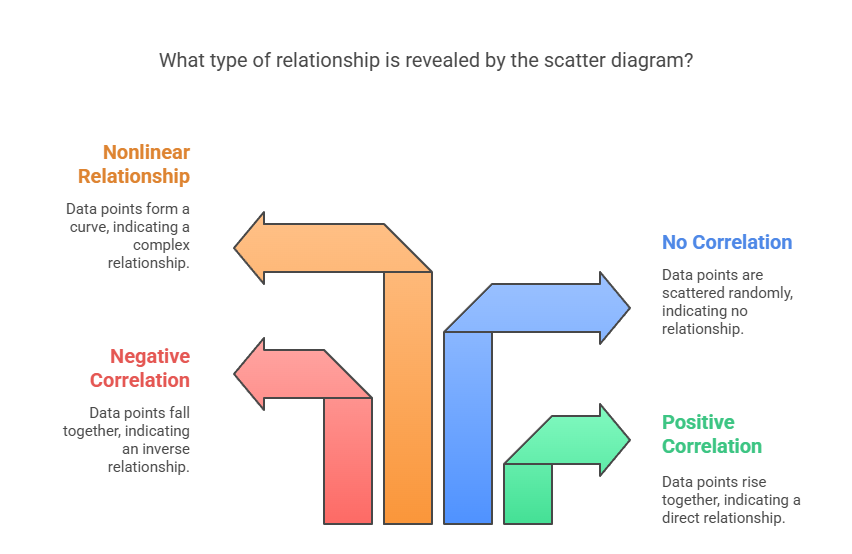
The patterns formed by the data points in a scatter diagram can reveal various types of relationships between the variables. Understanding these patterns is crucial for interpreting what the data is telling you.
Positive Correlation
As the value of the X variable increases, the value of the Y variable also increases.
Visual Pattern: Points trend upward from left to right.
Example: Height vs. weight in humans-taller people tend to weigh more.
Negative Correlation
As the value of the X variable increases, the value of the Y variable decreases.
Visual Pattern: Points trend downward from left to right.
Example: Number of hours spent watching TV vs. exam scores-more TV time is associated with lower scores.
No Correlation
There is no discernible pattern; the variables appear unrelated.
Visual Pattern: Points are scattered randomly with no trend.
Example: Shoe size vs. intelligence-no logical relationship.
Nonlinear Relationship
The relationship between the variables is not a straight line but may form a curve.
Visual Pattern: Points may form a U-shape, S-shape, or another curve.
Example: Stress vs. performance-performance may increase with stress up to a point, then decrease.
Perfect Correlation
All points lie exactly on a straight line.
Visual Pattern: A straight line with no deviation.
Example: The relationship between Celsius and Fahrenheit temperatures.
Degrees of Correlation
Strong Correlation: Points are closely clustered around a line.
Weak Correlation: Points are more widely scattered but still show a general trend.
How to Create a Scatter Diagram
Creating a scatter diagram is a straightforward process, whether you do it by hand, in Excel, Google Sheets, or with statistical software.
Step 1: Collect Data
Gather paired numerical data for the two variables you wish to compare. For example, hours studied and exam scores for a group of students.
Step 2: Identify Variables
Decide which variable is independent (X-axis) and which is dependent (Y-axis).
Step 3: Draw Axes
Draw two perpendicular lines to form the X and Y axes. Mark equal intervals on both axes.
Step 4: Plot Data Points
For each pair of values, find the corresponding position on the X and Y axes and mark a dot.
Step 5: Analyse the Pattern
Look for trends, clusters, outliers, or patterns in the distribution of points.
Step 6: Add a Trend Line (Optional)
Draw a line of best fit to summarize the overall trend. In Excel or Google Sheets, this can be done automatically.
Scatter Diagram Example
Suppose you have the following data:
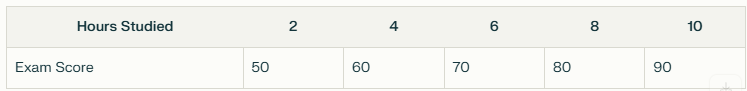
Plotting these points on a scatter diagram would show a strong positive correlation: as hours studied increase, exam scores rise.
Creating a Scatter Diagram in Excel or Google Sheets
Step 1: Enter your data in two columns.
Step 2: Highlight the data.
Step 3: Go to the “Insert” menu and select “Scatter” from the chart options.
Step 4: Add axis titles and a chart title for clarity.
Step 5 (Optional): Add a trend line by right-clicking on a data point and selecting “Add Trendline.”
Applications of Scatter Diagrams in Real Life
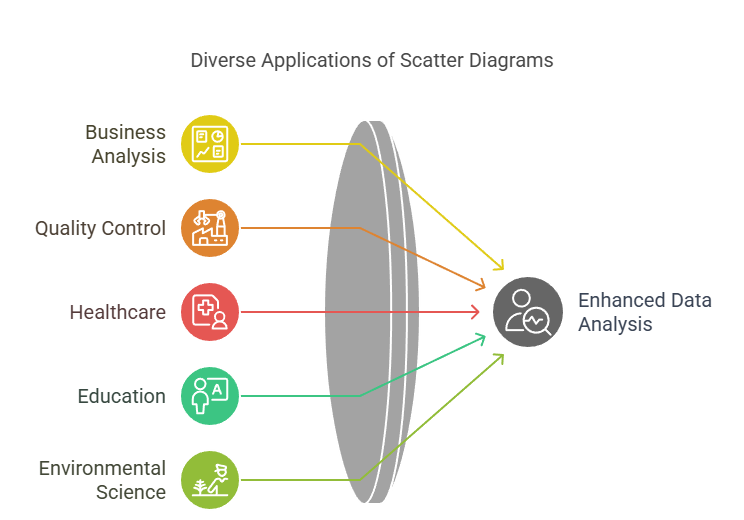
Scatter diagrams are versatile and find applications in a wide range of fields. Here are some of the most common uses of scatter diagrams in statistics and everyday life:
Business: Sales and Marketing Analysis
Scatter diagrams widely used to analyse the relationship between variables such as advertising spend and sales revenue. By plotting these data points, businesses can visually assess whether increased marketing efforts are associated with higher sales, helping to optimize marketing strategies and budgets.
Quality Control and Manufacturing
In manufacturing, scatter diagrams help identify relationships between process parameters (like machine speed or temperature) and product quality (such as defect rate). This assists engineers in pinpointing root causes of defects and improving production processes for better quality outcomes.
Healthcare and Medicine
Researchers use scatter diagrams to study correlations such as patient age versus blood pressure, or medication dosage versus recovery time. These visualizations support medical research, clinical decision-making, and the identification of risk factors for better patient care.
Education: Student Performance
Educators employ scatter diagrams to explore the link between study hours and exam scores or attendance and academic performance. This helps identify patterns that can inform teaching strategies and student support initiatives.
Environmental Science and Agriculture
Scatter diagrams use to investigate relationships such as temperature versus ice cream sales, rainfall versus crop yield, or pollution levels versus respiratory illnesses. These insights guide policy decisions, resource allocation, and environmental management.
Limitations of Scatter Diagrams
While scatter diagrams are powerful tools for visualizing relationships between two numerical variables, they come with several important limitations that users should be aware of:
Limited to Two Variables
Scatter diagrams can only display the relationship between two variables at a time. If you need to analyse interactions among three or more variables, you must use multiple scatter plots or more advanced visualization techniques.
Not Suitable for Categorical Data
Scatter diagrams design for continuous or discrete numerical data. They are not effective for categorical or nominal data, where bar charts or other visualizations are more appropriate.
Difficulty Quantifying Relationships
While scatter diagrams visually suggest relationships, they do not provide a precise measure of correlation. Additional statistical calculations need to quantify the strength and direction of the relationship.
Misinterpretation of Correlation as Causation
A key risk is assuming that a visible relationship means one variable causes changes in the other. Scatter diagrams only show association, not causation; observed patterns may be due to a third variable or coincidence.
Sensitive to Outliers and Data Variation
Outliers or extreme values can distort the apparent relationship and make trends harder to interpret, leading to potential misinterpretation of the data.
Challenging with Nonlinear Relationships
Scatter diagrams are most effective for identifying linear relationships. They may not clearly reveal more complex, nonlinear patterns in the data.
Manual Data Entry Errors
Creating scatter diagrams manually can introduce errors in data input or plotting, affecting the accuracy of the visualization.
Conclusion
A scatter diagram is a foundational statistical tool that visually represents the relationship between two numerical variables. By plotting data points on a Cartesian plane, it helps analysts detect patterns, assess correlation, and identify outliers.
Widely used in business, science, engineering, education, and quality control, scatter diagrams are simple yet powerful aids for data exploration and decision-making.
While scatter diagrams have their limitations-such as only showing association, not causation, and limited to two variables at a time-their clarity and versatility make them indispensable in the toolkit of anyone working with data. They provide a visual gateway to deeper statistical analysis and more informed, data-driven decisions.
Frequently Asked Questions
What Is the Main Use of a Scatter Diagram in Statistics?
A scatter diagram primarily used to visually examine the relationship between two numerical variables, helping to identify the direction, strength, and form of their association before applying further statistical analysis.
Can Scatter Diagrams Show Causation Between Variables?
No, scatter diagrams only indicate correlation or association, not causation. While they can suggest a possible relationship, additional statistical tests and experimental evidence needed to establish causality.
How Do You Interpret a Scatter Diagram With No Apparent Pattern?
If a scatter diagram shows points randomly scattered with no clear trend, it suggests there is no linear relationship between the variables. However, further analysis may need to check for nonlinear associations or other influencing factors.
Authors
-

Written by:
Neha SinghReviewed by: