Summary: Contingency table statistics summarize and analyse relationships between categorical variables by displaying their joint frequency distributions in a matrix. These tables facilitate probability calculations, hypothesis testing, and association analysis. Commonly used in research, business, and healthcare, contingency tables provide a clear, visual method for interpreting categorical data and drawing meaningful insights.
Introduction to Contingency Tables
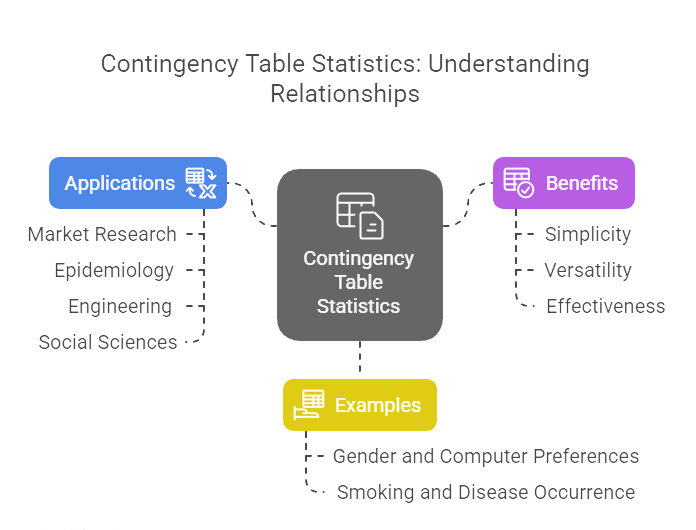
In the world of statistics, understanding the relationship between two categorical variables is crucial for uncovering patterns and making informed decisions. Contingency table statistics provide a powerful and intuitive way to organize and analyse such data.
Imagine a marketing analyst trying to determine if gender influences computer purchase preferences, or a medical researcher investigating the association between smoking status and disease occurrence.
In both cases, contingency tables are the go-to tool for summarizing and examining the joint distribution of two or more categorical variables. Their simplicity, versatility, and effectiveness have made them a staple in fields like market research, epidemiology, engineering, and social sciences.
Key Takeaways
- Contingency tables display frequency distributions for two or more categorical variables.
- They help identify associations, dependencies, or independence between variables.
- Chi-square tests are commonly used for statistical analysis of contingency tables.
- Widely applied in surveys, scientific research, and healthcare data analysis.
- Effective for descriptive analysis, probability estimation, and hypothesis testing with categorical data
Structure of a Contingency Table
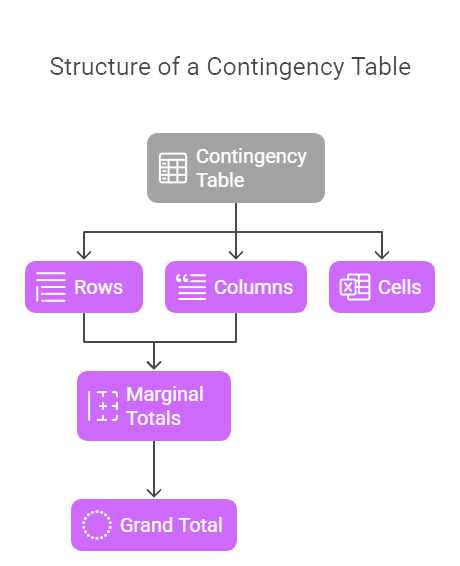
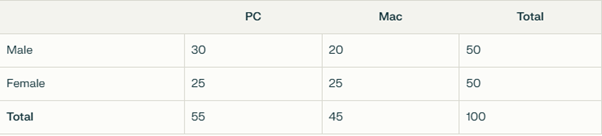
A contingency table, also known as a cross-tabulation or cross-classification table, is a matrix that displays the frequency distribution of variables. Typically, one variable is represented in the rows and another in the columns. Each cell in the table shows the count (or frequency) of cases for a specific combination of the two variables.
Key elements of a contingency table:
- Rows: Categories of one variable (e.g., gender: male, female)
- Columns: Categories of the other variable (e.g., computer type: PC, Mac)
- Cells: Intersection points showing the frequency for each combination
- Marginal Totals: Sums of rows and columns, representing totals for each category
- Grand Total: The sum of all frequencies in the table
Example:
Key Terms in Contingency Tables
To effectively use contingency table statistics, it’s important to understand these key terms:
- Cell Frequency: The count in each cell, representing the number of observations for a specific combination of categories.
- Marginal Totals: The sum of frequencies for each row or column, indicating the total for each category of a variable.
- Grand Total: The sum of all cell frequencies, representing the total sample size.
- Joint Distribution: The distribution of frequencies across all combinations of the two variables.
- Marginal Distribution: The distribution of one variable, ignoring the other (found in the margins).
- Conditional Distribution: The distribution of one variable for a specific category of the other variable.
- Independence: Two variables are independent if the distribution of one does not depend on the other. If not, they are said to be contingent or associated.
How to Create a Contingency Table

Creating a contingency table is a fundamental step in analysing the relationship between categorical variables. This process involves systematically organizing raw data into a matrix format, tallying frequencies for each category combination, and calculating totals. Understanding how to create a contingency table is essential for effective categorical Data Analysis.
Collect and Categorize Data
Start by gathering data for two (or more) categorical variables. For each observation, record the category for both variables.
Tally Frequencies
Count how many observations fall into each possible combination of categories. This is often done using tally marks or spreadsheet functions.
Organize into a Table
Arrange the counts in a matrix, with one variable’s categories as rows and the other’s as columns. Fill in the cell frequencies, then compute the marginal and grand totals.
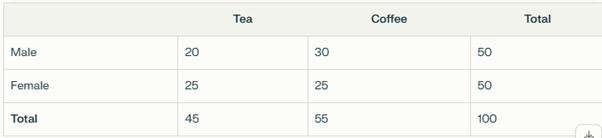
Example:
Suppose you survey 100 people about their preferred beverage (Tea or Coffee) and gender (Male or Female):
Calculate Percentages (Optional)
You can convert frequencies to percentages to better understand proportions, either by row, column, or overall.
Interpret the Table
Look for patterns, such as whether one group favours a particular category more than another.
Analysing Contingency Tables
Contingency table statistics are not just about organizing data-they are about analysing relationships between variables. Here’s how to analyses a contingency table:
Descriptive Analysis
- Frequencies: Examine the raw counts in each cell.
- Percentages: Calculate row, column, or overall percentages to compare proportions.
Statistical Tests
To determine if there is a significant association between the variables, use statistical tests such as:
- Chi-Square Test of Independence: The most common test for contingency tables, it checks if the observed frequencies differ significantly from what would be expected if the variables were independent.
Contingency Table Statistics Formula (Chi-Square):
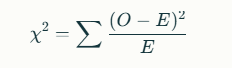
Where
- O is the observed frequency, and
- E is the expected frequency in each cell.
- Fisher’s Exact Test: Used for small sample sizes, especially in 2×2 tables.
Odds Ratio and Relative Risk: Quantify the strength of association between variables, often used in medical research.
Interpreting Results
If the test statistic is significant, there is evidence of association (contingency) between the variables.
If not, the variables are likely independent.
Example Analysis
Suppose a chi-square test on the beverage preference table yields a p-value of 0.04. Since this is less than 0.05, you conclude that beverage preference is associated with gender in your sample.
Applications of Contingency Tables
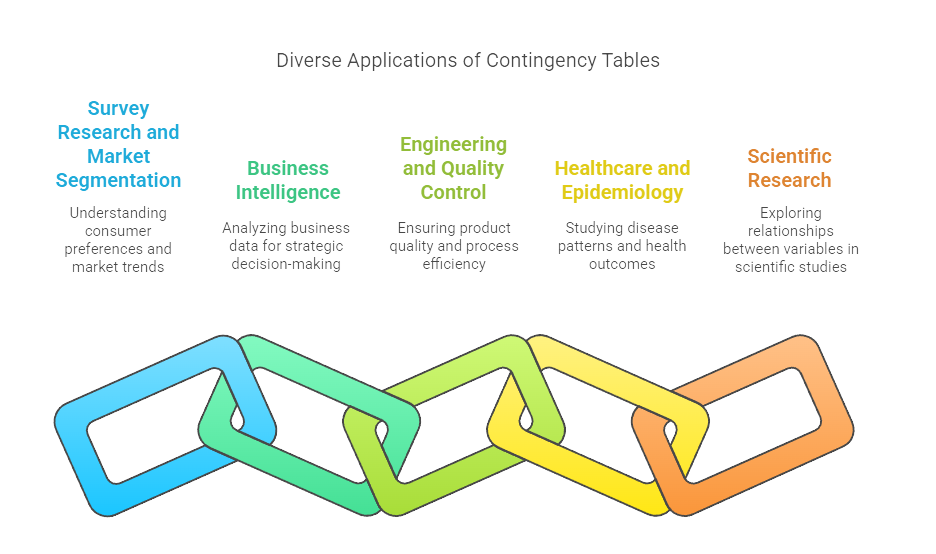
Contingency tables have broad applications across numerous fields due to their ability to efficiently summarize and analyses the relationship between two or more categorical variables. Here are some key applications of contingency tables, supported by real-world examples and common use cases:
Survey Research and Market Segmentation
Contingency tables are widely used in survey analysis to compare how different groups (e.g., age, gender, region) respond to various questions or show preferences. For example, marketers can use them to map customer segments and visually compare how different demographics prefer specific products or services, helping identify outlier segments or unique customer needs.
Business Intelligence
In business, contingency tables help analyses customer behaviour, product usage, or purchase patterns across categories such as region, time period, or customer type. For instance, a sales team might use a contingency table to determine if customer satisfaction is related to repeat purchases, guiding targeted marketing or retention strategies.
Engineering and Quality Control
Engineers use contingency tables to track defect rates or process outcomes across different production lines, shifts, or machines. This helps pinpoint sources of variation and improve quality by identifying significant associations between categorical factors and outcomes.
Healthcare and Epidemiology
In medical research, contingency tables are essential for studying associations between risk factors (like smoking or medication use) and health outcomes (such as disease presence or recovery rates). They are also used to calculate odds ratios and relative risks, supporting evidence-based decisions in clinical practice.
Scientific Research
Scientists use contingency tables to explore relationships between categorical variables in experiments, such as the effect of treatment (yes/no) on recovery (yes/no) or the relationship between sex and handedness in population studies
Limitations of Contingency Tables
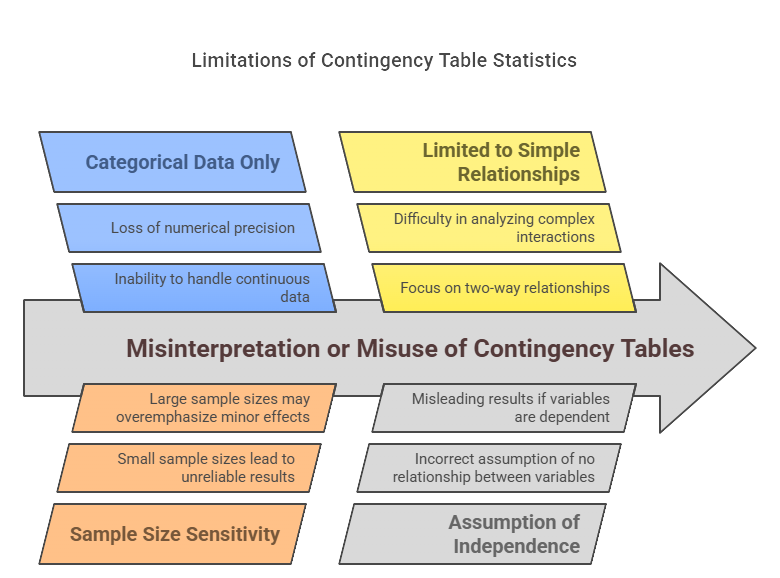
While contingency table statistics are a cornerstone of categorical Data Analysis, they come with several important limitations that users must consider to avoid misinterpretation or misuse:
Categorical Data Only
Contingency tables are designed for categorical (nominal or ordinal) variables. They cannot directly handle continuous variables unless those variables are artificially divided into categories (binned), which can oversimplify or distort the underlying data patterns. This process may also introduce arbitrary cutoffs that affect the analysis.
Sample Size Sensitivity
Statistical tests based on contingency tables, such as the chi-square test, require sufficiently large sample sizes for reliable results. Small samples can lead to unstable estimates, inflated variability, and unreliable p-values.
Sparse tables, where many cells have low counts, further reduce the validity of statistical conclusions. Research suggests that at least 400 participants are needed for stable estimates in clinical prediction or similar analyses.
Limited to Simple Relationships
Contingency tables are excellent for summarizing associations between two variables but are limited in their ability to capture complex, multivariate relationships or account for confounding variables. They do not establish causality, only association, and may oversimplify real-world relationships.
Complexity with Many Variables or Categories
As the number of variables or categories increases, contingency tables become larger and more complex, making them difficult to interpret and visualize. High-dimensional tables (more than two variables) are especially challenging, often leading to sparse data and reduced statistical power.
Assumption of Independence
Statistical tests for contingency tables (e.g., chi-square, Fisher’s exact test) assume that observations are independent and that data are randomly sampled from the population. Violating these assumptions-such as through repeated measures, clustered data, or structural zeroes-can result in misleading or invalid results.
Conclusion
Contingency table statistics are a cornerstone of categorical Data Analysis, offering a clear and effective way to explore relationships between variables.
From constructing the table to performing statistical tests, they enable analysts and researchers to uncover meaningful patterns and associations in data. While they have limitations, their versatility and simplicity ensure their continued use across disciplines.
Frequently Asked Questions
How Do You Calculate a Contingency Table?
To calculate a contingency table, tally the number of observations for each combination of categories from two categorical variables, organize these counts into a matrix, and compute marginal and grand totals.
What Is the Main Statistical Test Used with Contingency Tables?
The chi-square test of independence is the primary statistical test used with contingency tables. It assesses whether there is a significant association between the variables by comparing observed and expected frequencies.
What Are Some Common Applications of Contingency Tables?
Contingency tables are used in market research, healthcare, social sciences, quality control, and education to analyse relationships between categorical variables, such as customer preferences, disease risk factors, or teaching outcomes.
What Are the Limitations of Contingency Tables?
Contingency tables are limited to categorical data, may be unreliable with small or sparse samples, cannot establish causality, and become difficult to interpret with more than two variables or many categories.
Authors
-

Written by:
Neha SinghReviewed by: