Summary: A time series model 3300 is a statistical tool that analyzes data points over time to identify trends, seasonality, and patterns. These models are essential for forecasting in fields like finance, retail, and healthcare. Understanding their components and uses helps businesses make informed, data-driven decisions for future planning.
Introduction
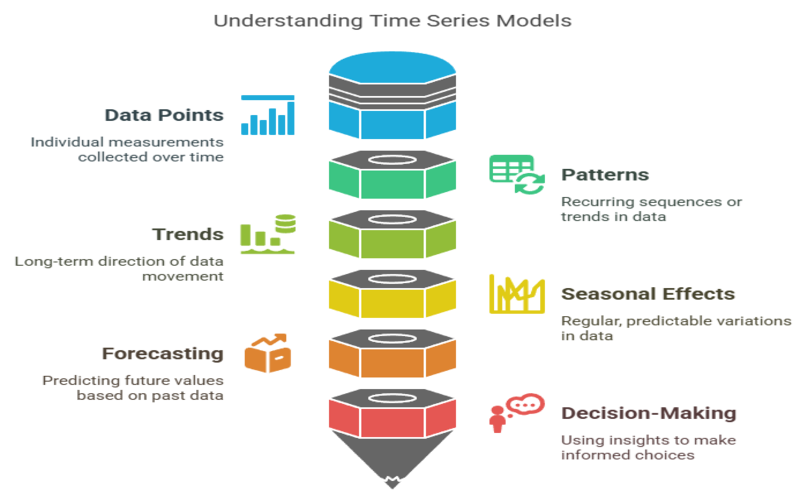
Imagine you own a small retail store and want to predict how many customers will visit next month. You look at your sales data from the past few years and notice certain patterns—more customers during holidays, fewer on rainy days, and a steady increase over time. This is where a time series model becomes invaluable. A time series model analyzes data points collected in chronological order to identify patterns, trends, and seasonal effects.
By understanding these patterns, you can forecast future values, helping you make smarter business decisions like managing inventory or planning promotions. In this blog, we’ll explore what a time series model is, its key components, how to build one, and its real-world applications across various industries.
A time series model is a statistical tool used to analyze data points collected over time. These models help identify patterns, trends, and dependencies, allowing for accurate forecasting and decision-making. Time series models are widely used in finance, economics, weather prediction, and many other fields to understand and predict future outcomes.
Key Takeaways
- Time series models analyze data points collected in chronological order.
- Key components include trend, seasonality, cycles, and noise.
- Stationarity is crucial for accurate time series forecasting.
- Applications span finance, retail, healthcare, and more industries.
- Proper modeling leads to smarter, data-driven business decisions.
Characteristics of Time Series Models
Time series models have unique characteristics that distinguish them from other data models. They capture dependencies between observations, account for periodic patterns, and require specific conditions like stationarity for accurate forecasting. Understanding these characteristics is essential for building robust and reliable time series models.
Autocorrelation
Autocorrelation measures how current values in a time series relate to previous values. High autocorrelation means past values strongly influence future ones, which is common in financial and weather data. Recognizing autocorrelation helps in selecting the right model and improving prediction accuracy.
Seasonality
Seasonality refers to repeating patterns or cycles in data, often tied to calendar periods like days, months, or years. For example, retail sales often increase during holidays. Identifying seasonality allows models to adjust for regular fluctuations and make more accurate forecasts.
Stationarity
A stationary time series has a constant mean and variance over time. Stationarity is crucial because many time series models assume it. Non-stationary data can lead to unreliable predictions, so transformations like differencing or detrending are often applied to achieve stationarity.
Components of Time Series

The components of time series are the building blocks that explain the structure and behavior of time-based data. These include trend, seasonality, cycles, and noise. Recognizing these components helps in selecting appropriate models and improving forecasting accuracy.
Trend
The trend component shows the long-term direction of the data, whether it’s increasing, decreasing, or stable. Trends help identify overall growth or decline in a dataset, such as rising stock prices or declining sales over years.
Seasonality
Seasonality captures regular, repeating patterns within a fixed period, like higher ice cream sales in summer. Understanding seasonality helps businesses plan for predictable changes and optimize operations.
Cyclic Component
Cycles are long-term fluctuations that don’t follow a fixed calendar pattern, such as economic booms and busts. Distinguishing cycles from seasonality is important for understanding broader changes in data.
Noise
Noise represents random, unpredictable variations in the data. It’s the “background” fluctuation that can’t be explained by trend, seasonality, or cycles. Reducing noise is key to improving model accuracy.
Types of Time Series

Types of time series are categorized by their patterns and structures. Understanding these types helps analysts choose the right modeling approach and interpret results effectively. Common types include stationary, non-stationary, seasonal, and non-seasonal time series.
Stationary Time Series
A stationary time series has statistical properties like mean and variance that remain constant over time. These are easier to model and forecast, as their behavior doesn’t change unpredictably.
Non-Stationary Time Series
Non-stationary time series show trends, changing variance, or other evolving patterns. They often require transformation before modeling to ensure reliable predictions.
Seasonal Time Series
Seasonal time series exhibit regular, repeating patterns at fixed intervals, such as monthly sales or yearly temperature changes. Recognizing seasonality is crucial for accurate forecasting.
Non-Seasonal Time Series
Non-seasonal time series lack regular repeating patterns. They may still have trends or cycles, but don’t follow a predictable seasonal schedule.
Importance of Time Series
The importance of time series lies in its ability to reveal patterns, predict future values, and support data-driven decisions. Time series analysis is vital for industries like finance, healthcare, and retail, where understanding changes over time leads to better planning and strategy.
Forecasting
Time series models enable accurate forecasting by identifying patterns and relationships in historical data. This helps businesses anticipate demand, manage inventory, and allocate resources effectively.
Pattern Recognition
Analyzing time series reveals trends, cycles, and anomalies, helping organizations understand underlying processes. Recognizing these patterns supports proactive decision-making and risk management.
Performance Monitoring
Time series analysis tracks performance metrics over time, allowing businesses to measure progress, identify issues, and implement improvements. Continuous monitoring is essential for maintaining competitiveness.
How to Test Whether a Process Is Stationary
Testing for stationarity is a critical step in time series modeling. Stationary data is required for many models to produce reliable results. There are several tests and visual methods to determine if a time series is stationary.
Visual Inspection
Plotting the data over time can reveal trends, changing variance, or seasonality. If the mean and variance appear stable, the series may be stationary. Visual inspection is a quick, initial check before formal testing.
Augmented Dickey-Fuller (ADF) Test
The ADF test statistically determines whether a time series is stationary. A low p-value indicates stationarity, while a high p-value suggests non-stationarity. This test is widely used for its reliability and ease of interpretation.
Transformations
If a series is non-stationary, techniques like differencing, detrending, or logarithmic transformation can be applied. These methods help stabilize the mean and variance, making the data suitable for modeling.
How to Build a Time Series Model

Building a time series model involves several key steps, from data preparation to model selection and evaluation. Following a structured process ensures accurate and actionable forecasts that support business goals.
Data Preparation
Collect and clean time-based data, handling missing values and outliers. Proper data preparation ensures the model is built on reliable information, improving its accuracy and robustness.
Decomposition
Break down the series into its components—trend, seasonality, and noise. Decomposition helps identify underlying patterns and guides the choice of modeling techniques.
Model Selection
Choose an appropriate model, such as ARIMA, Exponential Smoothing, or machine learning-based approaches. The choice depends on data characteristics like stationarity and seasonality.
Model Training and Validation
Fit the model to historical data and validate its performance using techniques like cross-validation. This step ensures the model generalizes well to new data and avoids overfitting.
Applications of Time Series Models
Time series models have widespread applications across industries. They are essential for forecasting, anomaly detection, and understanding temporal patterns, making them invaluable tools for decision-makers in various fields.
Financial Forecasting
Time series models predict stock prices, interest rates, and market trends, helping investors and analysts make informed decisions. Accurate financial forecasting can lead to better investment strategies and risk management.
Demand Planning
Businesses use time series models to forecast product demand, optimize inventory, and plan supply chains. This improves efficiency, reduces costs, and ensures products are available when needed.
Weather Prediction
Meteorologists rely on time series models to forecast temperature, rainfall, and other weather variables. These predictions support agriculture, disaster management, and daily planning.
Healthcare Analytics
Time series models monitor patient health metrics, track disease outbreaks, and optimize resource allocation in hospitals. This leads to improved patient care and operational efficiency.
Examples of Forecasting With Time Series Models
Forecasting with time series models involves using historical data to predict future values. Real-world examples demonstrate the effectiveness of these models in various domains, from business to science.
Retail Sales Forecasting
Retailers use time series models to predict future sales based on past performance. This helps in managing inventory, planning promotions, and maximizing revenue during peak seasons.
Energy Consumption Prediction
Utility companies forecast energy demand using time series analysis. Accurate predictions help balance supply and demand, prevent outages, and support sustainable energy management.
Traffic Flow Analysis
City planners analyze traffic data to predict congestion and optimize signal timings. Time series models enable smarter urban planning and improved transportation systems.
Time Series Model Example: Predicting Stock Prices

Predicting stock prices is a classic use case for time series models. These models analyze historical price data to forecast future movements, aiding investors and traders in making better financial decisions.
Data Collection
Gather historical stock prices, including open, close, high, and low values. Reliable data is essential for building an accurate predictive model.
Model Selection and Training
Choose a suitable model, such as ARIMA or LSTM, based on the data’s characteristics. Train the model on historical data to capture patterns and dependencies.
Forecasting and Evaluation
Use the trained model to predict future stock prices. Evaluate its performance using metrics like Mean Absolute Error (MAE) or Root Mean Squared Error (RMSE) to ensure reliability.
Conclusion
Time series models are powerful tools for analyzing and forecasting data collected over time. By understanding their characteristics, components, and applications, businesses and professionals can make informed decisions and anticipate future trends. To master time series analysis, consider enrolling in our comprehensive course or consulting our expert services.
Frequently Asked Questions
What Is a Time Series Model?
A time series model is a statistical method used to analyze and forecast data points collected over time. It identifies patterns, trends, and dependencies to make predictions about future values.
What are the Four Types of Time Series Models?
The four main types are AR (Autoregressive), MA (Moving Average), ARMA (Autoregressive Moving Average), and ARIMA (Autoregressive Integrated Moving Average). Each type is suited to different data patterns and forecasting needs.
What Is the Time Series Model Technique?
Time series model techniques involve collecting time-based data, decomposing it into components, testing for stationarity, selecting a model, and using it to forecast future values. Techniques include ARIMA, Exponential Smoothing, and machine learning approaches.
What is an Example of a Time Series Model?
An example is using ARIMA to forecast monthly sales for a retail store. The model analyzes past sales data, identifies trends and seasonality, and predicts future sales to aid inventory and marketing decisions.
Authors
-

Written by:
Neha SinghReviewed by: