Summary: R Programming vs Python are leading languages in Data Science. R offers statistical depth and strong visuals, while Python is user-friendly and versatile. Your choice depends on your goals. Enrol in Pickl.AI’s courses to master the right language for your data career and become a confident Data Scientist.
Introduction
In today’s data-driven world, choosing the right tools can significantly affect how effectively we work with data. One of the most important decisions for anyone interested in data science is to pick the correct programming language.
Among the top choices are R programming and Python—two powerful tools that help people analyze data, find trends, and make smart decisions.
Both R and Python are widely used by data scientists, researchers, and analysts worldwide. Python is the most popular programming language today, used by 51% of developers worldwide in 2024. R, on the other hand, is trusted by more than 2 million statisticians and data professionals, especially for statistical analysis.
The global market for programming languages is also booming. It’s expected to grow from $181.15 billion in 2024 to $201.19 billion in 2025, which shows how important these tools have become.
In this blog, we’ll take a smart and simple look at how R and Python compare in data science. Whether you’re a beginner or just curious, you’ll find out which one might better fit your needs.
Key Takeaways
- R excels in statistics and data visualization, making it ideal for researchers and analysts.
- Python is more versatile, perfect for machine learning, automation, and web applications.
- Beginners prefer Python due to its readable syntax and broad community support.
- Both have strong libraries, but R leans statistically while Python has a broader scope.
- Learning both languages can provide an edge in the competitive Data Science job market.
What is Data Science?
data science uses data to answer questions, solve problems, and make decisions. It mixes different skills — like math, statistics, and computer programming — to find patterns and insights hidden in data.
Companies in every industry now rely on data science to improve products, understand customers, and predict the future. That’s why the demand for data scientists is growing fast, and knowing the correct programming language is key.
A Quick Look
Both R and Python are excellent choices for data science, but they have different backgrounds:
- R was built mainly for statistics and data visualization.
- Python is a general-purpose language known for being easy to learn and highly flexible.
Let’s dive into their strengths, weaknesses, and how they’re used in the real world.
R Programming
R is a programming language created by statisticians in the 1990s. It was made specifically to handle data, do statistical calculations, and make charts. That’s why it’s very popular in academic research, healthcare, finance, and social sciences.
Key Features of R
- Strong in Statistics: R offers many statistical analysis tools, from basic math to complex models.
- Great Visuals: With libraries like ggplot2, R can make beautiful, detailed charts and graphs.
- Community Support: R has a loyal user base, especially among statisticians. Its package library, CRAN, has thousands of helpful tools.
Common Use Cases for R
- Analyzing data from clinical trials.
- Creating academic research reports.
- Making detailed charts and plots for presentations.
- Exploring data in bioinformatics (like genes and proteins).
Python Programming
Python was created in 1991. It’s not just for data science—it’s used in web development, game design, automation, and more. But in recent years, thanks to its simplicity and powerful libraries, Python has become the go-to language for data science.
Key Features of Python
- User-Friendly: Python’s code looks almost like plain English, so it’s easy to read and write.
- Flexible: Python can do almost anything from websites to robots.
- Rich Libraries: Tools like Pandas, NumPy, and scikit-learn make data tasks easier and faster.
Common Use Cases for Python
- Cleaning and organizing messy data (called data wrangling).
- Building machine learning models to predict outcomes.
- Web scraping: collecting data from websites for analysis.
- Creating dashboards and apps to share data insights.
Learning Curve: Which One is Easier?
When starting in data science, one of the first challenges is coding. R and Python are popular choices but offer different learning experiences. Let’s explore how beginner-friendly each language is and what to expect as you learn them.
Learning R
R is excellent for people with a background in statistics. But for total beginners, it can feel tricky at first, especially if you’re unfamiliar with statistical terms. Still, it has good documentation and a strong online community.
Pros:
- Perfect for in-depth statistical work.
- Lots of guides and examples available.
Cons:
- It may be harder for beginners without a background in statistics.
- The coding style is a bit less intuitive than that of Python.
Learning Python
Python is known for being beginner-friendly. It is often recommended for people just starting out in programming or data science because it is easy to understand.
Pros:
- Simple and readable syntax.
- Helpful for many tasks beyond data science.
Cons:
- Not as focused on statistics as R, so that some advanced features might require extra effort.
- Too many options and tools can overwhelm beginners who don’t know where to start.
Comparing Libraries and Tools
One of the biggest strengths of both R and Python lies in the wide range of libraries and tools they offer. These libraries are toolkits that help data scientists perform complex tasks more easily. Let’s look at each language’s most popular libraries for data science.
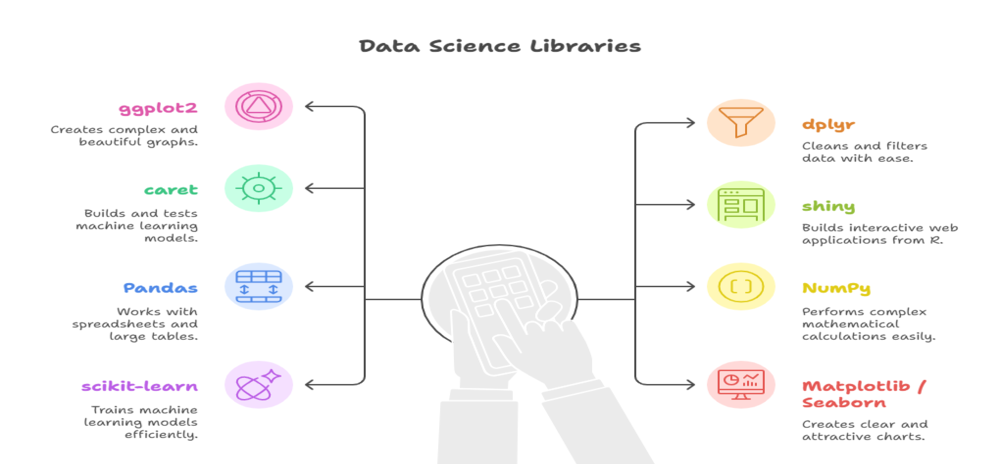
R Libraries
R has strong tools for statistics and graphics:
- ggplot2: Create beautiful and complex graphs.
- dplyr: Clean and filter your data easily.
- caret: Build and test machine learning models.
- shiny: Build interactive web apps straight from your R code. They are great for dashboards and sharing results.
Python Libraries
Python has a huge library ecosystem for all steps of data science:
- Pandas: Work with spreadsheets and large tables.
- NumPy: Perform mathematical calculations.
- scikit-learn: Train machine learning models.
- Matplotlib / Seaborn: Make clear and attractive charts.
Community and Support
Both R and Python have large, helpful communities.
- R Community: Includes many researchers and statisticians. Forums like RStudio Community and packages on CRAN are very active.
- Python Community: One of the biggest in the world. You’ll find help on GitHub, Stack Overflow, and countless tutorials and courses.
Performance and Speed
When working with large datasets or complex calculations, the performance and speed of a programming language can make a big difference. Whether you’re analyzing thousands of survey responses or training machine learning models, choosing a language that can handle the workload is essential. Let’s see how R and Python compare speed and processing power.
R’s Performance
R is built for statistical analysis and handles medium to large datasets well. Its functions are highly optimized for statistical tasks, making it ideal for data-heavy research. However, when working with extremely large datasets or real-time data, R can face performance issues, especially with memory management.
Python’s Performance
Python is known for its flexibility and adaptability. While it may not be as intensely focused on statistics as R, it performs well across various tasks. Tools like NumPy, Cython, and Dask help Python handle large-scale data processing efficiently and speed up heavy computations.
Which One Should You Choose?

Choosing between R and Python depends on your background, goals, and the kind of work you plan to do. Both languages are excellent for data science, but each serves different purposes better. Here’s a simple way to decide which language might be the right fit for you.
Choose R if:
- You are working heavily with statistics and charts.
- You are in research, academia, or bioinformatics.
- You want deep analysis with excellent visuals.
Choose Python if:
- You want to explore machine learning, AI, or app development.
- You’re just starting with programming.
- You want one language for many tasks, not just data science.
Bottom Line
There is no one-size-fits-all answer regarding R programming vs Python for data science. Both languages are powerful, widely used, and backed by strong communities.
- R shines in statistical analysis and visualization.
- Python stands out for versatility and ease of use.
Think about your goals, the type of work you want, and which tools feel more natural. Whether you go with R, Python, or even both, you’ll be building a valuable skillset that opens the door to exciting opportunities in the world of data.
To dive deeper into the world of data and become job-ready, consider joining expert-led Data Science courses at Pickl.AI. These courses will guide you in mastering either R, Python, or both—equipping you with practical skills to thrive in the data-driven world.
Frequently Asked Questions
Which is better for beginners in Data Science: R or Python?
Python is better for beginners due to its simple syntax and versatility. It’s easy to learn, great for general programming, and widely used in the Data Science industry.
Is R still relevant in 2025 for Data Science?
Yes, R is still highly relevant. It’s widely used in academia, healthcare, and research for its powerful statistical tools and excellent data visualization capabilities.
Can I use both R and Python in my Data Science career?
Absolutely. Many data professionals use both. Python handles automation and machine learning, while R excels in statistical modeling and detailed analysis.
Authors
-

Written by:
Versha RawatReviewed by: