Summary: This post provides a deep dive into the K-Means vs DBSCAN debate. We compare the centroid-based K-Means algorithm with the density-based DBSCAN clustering method, exploring how each works, their primary advantages and limitations, and offering clear guidance on choosing the right algorithm for your data analysis needs.
Introduction
In the vast landscape of data science, the ability to find inherent groupings and patterns within data is a fundamental task. This is the realm of clustering, an unsupervised machine learning technique that groups similar data points together.
Among the many clustering algorithms available, two of the most popular and widely discussed are K-Means and DBSCAN. While both aim to partition data, their approaches, strengths, and weaknesses differ significantly.
This blog will delve deep into the k-means vs dbscan debate, exploring the intricacies of each algorithm to help you decide which is the right tool for your analytical needs.
Key Takeaways
- K-Means is best for large datasets with clear, spherical-shaped clusters.
- DBSCAN can identify clusters of arbitrary shapes and handles noise well.
- K-Means requires the number of clusters specified in advance; DBSCAN does not.
- DBSCAN is robust to outliers, while K-Means can be easily distorted by them.
- Choose based on data shape, noise, cluster count knowledge, and scalability needs.
What is Clustering in Data Science?
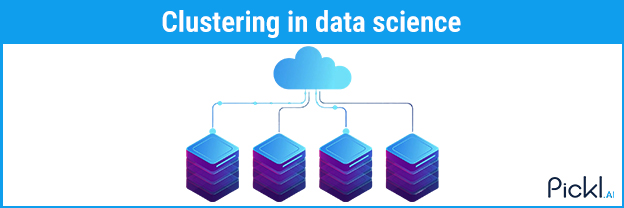
Clustering is the process of dividing a set of data points into several groups or “clusters” such that the data points in the same group are more similar to each other than to those in other groups. It’s an exploratory data analysis technique used in various fields like market segmentation, image recognition, anomaly detection, and bioinformatics.
Unlike supervised learning, clustering algorithms work with unlabeled data, meaning they discover patterns without any predefined categories.
K-Means Clustering
The k-means algorithm is one of the most well-known and simplest clustering methods. It is a centroid-based algorithm, meaning it aims to partition data into a predefined number of clusters, ‘K’, where each data point belongs to the cluster with the nearest mean or “centroid.”
How K-Means Works
The k-means algorithm operates iteratively to minimize the variance within each cluster. The process generally follows these steps:
Step 1: Initialization
First, you must specify the number of clusters, ‘K’. The algorithm then randomly selects ‘K’ data points from the dataset as the initial cluster centroids.
Step 2: Assignment
Each data point is assigned to the closest centroid, typically based on Euclidean distance. This step forms ‘K’ initial clusters.
Step 3: Update
The centroid of each cluster is recalculated by taking the mean of all data points assigned to that cluster.
Step 4: Iteration
Steps 2 and 3 are repeated until the cluster assignments no longer change, meaning the algorithm has converged.
The primary goal is to minimize the within-cluster sum of squares (WCSS), which is the sum of squared distances between each data point and its assigned centroid.
Advantages of K-Means
K-Means stands out for its simplicity, speed, and ease of interpretation, making it a practical choice for many clustering tasks, especially when working with large, well-separated datasets. Its guarantee of convergence, coupled with its transparent process, provides reliable and understandable results.
Easy to Understand and Implement
K-Means is one of the most straightforward clustering algorithms. Its steps—assigning points to the nearest centroid and then updating centroids—are intuitive and easy to follow, even for beginners.
Clear Cluster Representation
After running K-Means, each cluster is represented by a centroid (the mean of all points in the cluster). This makes it simple to interpret what each cluster represents in the data.
Algorithm Always Converges
K-Means is guaranteed to converge in a finite number of steps—eventually, the assignments of points to clusters stop changing, and centroids stabilize.
Limitations of K-Means
K-Means is a simple and efficient clustering algorithm, but its primary drawbacks are the need to predefine the number of clusters and its reliance on random initialization, which can cause inconsistent results.
Requirement to Specify K in Advance
K-Means requires you to specify the number of clusters (K) before the algorithm starts. In practice, it’s often difficult to know the optimal number of clusters for your data in advance.
Inconsistent Results
Because of this dependence on initialization, running K-Means multiple times on the same data may yield different clustering outcomes. This unpredictability limits the reliability of results.
DBSCAN Clustering
DBSCAN (Density-Based Spatial Clustering of Applications with Noise) is a density-based clustering algorithm. Unlike the centroid-based approach of K-Means, DBSCAN clustering defines clusters as dense regions of data points separated by areas of lower density.
How DBSCAN Works
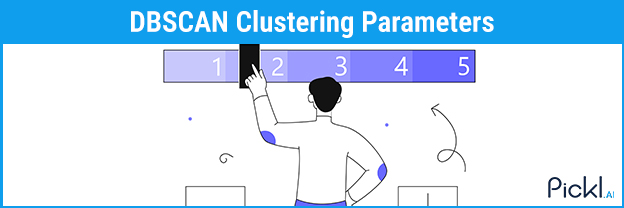
DBSCAN clustering groups together points that are closely packed, marking as outliers points that lie alone in low-density regions. It works based on two key parameters:
- Epsilon (ε): The maximum distance between two points for them to be considered neighbors.
- Minimum Points (MinPts): The minimum number of points required within the epsilon radius to form a dense region.
The algorithm classifies points into three types:
- Core Points: A point is a core point if it has at least MinPts within its ε-neighborhood.
- Border Points: A point that is within the ε-neighborhood of a core point but does not have enough of its own neighbors to be a core point.
- Noise Points (Outliers): A point that is neither a core nor a border point.
The process starts with an arbitrary point and retrieves its ε-neighborhood. If it’s a core point, a new cluster is formed. The cluster then expands by adding all directly reachable points, and this process continues until the cluster is fully explored.
Advantages of DBSCAN
DBSCAN (Density-Based Spatial Clustering of Applications with Noise) offers several notable advantages over traditional clustering algorithms:
No Need to Specify Number of Clusters
DBSCAN does not require you to predetermine the number of clusters. Instead, it discovers the number of clusters automatically based on data density, which is especially useful in exploratory data analysis when the underlying structure is unknown.
Ability to Find Arbitrarily Shaped Clusters
Unlike algorithms such as K-Means that assume clusters are spherical, DBSCAN can identify clusters of any shape and size—even if they are irregular, elongated, or nested within each other.
Robustness to Outliers and Noise
DBSCAN has a built-in mechanism to identify and label noise points or outliers, keeping clusters cleaner and more representative. Points that do not fit into any cluster based on the density criteria are marked as noise, enhancing the reliability of the results.
Handles Varying Cluster Densities
DBSCAN is capable of discovering clusters with different densities, making it flexible for many real-world datasets where cluster density may not be uniform
Limitations of DBSCAN
DBSCAN (Density-Based Spatial Clustering of Applications with Noise) is a powerful clustering algorithm, but it does have important limitations:
Sensitive to Parameter Selection
The results heavily depend on the choice of eps (neighborhood radius) and minPts (minimum cluster size). Poorly chosen values can lead to merging distinct clusters or missing meaningful ones, often requiring trial and error to tune properly.
Difficulty with Varying Cluster Densities
DBSCAN assumes a relatively uniform density for all clusters. If a dataset contains clusters with different densities, DBSCAN may fail to identify them correctly or may label dense areas as one cluster and sparser regions as noise, regardless of underlying structure.
High-Dimensional Data Performance
In high-dimensional spaces, distances between points become less meaningful (the “curse of dimensionality”), degrading DBSCAN’s performance. This can result in poor cluster assignments and often requires dimensionality reduction before using DBSCAN
K-Means vs DBSCAN: Key Differences
The choice between k-means vs dbscan depends heavily on the characteristics of your data and your goals. Here’s a summary of their key differences:
| Feature | K-Means Clustering | DBSCAN Clustering |
| Cluster Shape | Assume clusters are spherical and convex. | Can find arbitrarily shaped clusters. |
| Number of Clusters | Requires the number of clusters (K) to be specified in advance. | Automatically determines the number of clusters based on density. |
| Handling Outliers | Forces every point into a cluster, making it sensitive to outliers. | Identifies and marks outliers as noise, making it robust to them. |
| Approach | Centroid-based: groups data based on distance to a central point. | Density-based: groups data based on how closely packed points are. |
| Parameters | Requires ‘K’ (number of clusters). | Requires ‘eps’ (radius) and ‘MinPts’ (minimum points). |
| Dataset Suitability | Works well for well-separated, globular clusters. | Ideal for datasets with noise, irregular shapes, and unknown cluster counts. |
Conclusion
In the k-means vs dbscan comparison, there is no one-size-fits-all answer. The k-means algorithm is a fast, simple, and effective choice when you have a general idea of the number of clusters and your data forms relatively distinct, spherical groups.
However, for more complex, real-world datasets that may contain noise, outliers, and irregularly shaped clusters, DBSCAN clustering offers a more flexible and robust solution. By understanding the fundamental differences in their approaches, advantages, and limitations, data scientists can make an informed decision and choose the algorithm that will best uncover the hidden patterns within their data.
Frequently Asked Questions
What is the main difference between K-Means and DBSCAN?
The primary difference lies in their core approach. K-Means is a centroid-based algorithm that partitions data into a predefined number of spherical clusters. In contrast, DBSCAN is a density-based algorithm that groups points into arbitrarily shaped clusters based on their density and can identify outliers.
When should I use DBSCAN instead of K-Means?
You should use DBSCAN when you do not know the number of clusters in your data, your data contains noise or outliers, and you suspect the clusters are of irregular shapes. K-Means struggles with these scenarios, whereas DBSCAN is specifically designed to handle them effectively.
Which clustering algorithm is better for noisy data?
DBSCAN is generally considered the better algorithm for noisy data. Its “N” stands for “noise,” and it has an inherent mechanism to identify and label data points that do not belong to any dense cluster as outliers, making it more robust in the presence of noise than K-Means.
What are the limitations of K-Means and DBSCAN?
K-Means’ main limitations are its requirement to pre-specify the number of clusters, its sensitivity to initial centroid placement and outliers, and its assumption of spherical clusters. DBSCAN’s key limitations include its sensitivity to the eps and MinPts parameters and its difficulty with clusters of varying densities and high-dimensional data.
Authors
-

Written by:
Neha SinghReviewed by: