Summary: Our Pandas cheat sheet concisely references essential commands and functions in data manipulation, cleaning, and visualisation. Ideal for data scientists and analysts, it enhances productivity and efficiency.
Introduction
The Pandas cheat sheet provides a valuable resource for data scientists and analysts. It offers a collection of critical commands and functions for efficient data manipulation using the Pandas library in Python. This cheat sheet covers essential operations from reading data in various formats like CSV, Excel, and SQL to filtering, sorting, and aggregating data.
It’s a go-to reference for quick and effective data handling, enabling professionals to streamline their data analysis processes. Whether a beginner or an experienced Data Scientist, this Pandas cheat sheet on GitHub can significantly boost your productivity and problem-solving skills.
The Python library Pandas is an indispensable tool in data manipulation and analysis. Whether you’re a Data Scientist, a Business Analyst, or just a Python enthusiast, Pandas offers a versatile set of tools that allows you to work with data efficiently and effectively.
This comprehensive guide will delve into the Python Pandas cheatsheet, providing a complete reference and cheat sheet for mastering this powerful library.
Understanding Pandas
Pandas is an open-source data manipulation library built on top of Python. It offers versatile data structures and functions that simplify working with structured data. With Pandas, you can effortlessly read, write, clean, filter, and analyse data. Its powerful capabilities allow you to handle large datasets and perform complex data operations efficiently.
Pandas support various file formats, including CSV, Excel, and SQL databases, making them incredibly useful for data integration. Mastering Pandas is essential for any data professional, significantly enhancing efficiency and accuracy in data-related tasks.
Data Structures in Pandas
Data structures in Pandas include Series and DataFrame. A Series is a one-dimensional array-like object, while a DataFrame is a two-dimensional table with rows and columns. These structures enable efficient data manipulation, analysis, and handling of heterogeneous data types. Let’s look at them one by one:
Series
A Pandas Series is a one-dimensional, array-like object storing various data types, such as integers, floats, strings, etc. It operates similarly to a column in a spreadsheet, providing a powerful way to handle data in Python. Each element in a Series is associated with a unique index, making data retrieval and manipulation efficient.
You can perform numerous operations on a Series, including arithmetic, filtering, and aggregation. This flexibility allows for quick and effective data analysis. Additionally, the Series supports integer-based and label-based indexing, further enhancing its usability in data science and analysis tasks.
DataFrame
A DataFrame in Pandas is a two-dimensional, size-mutable, and heterogeneous tabular data structure. It features labelled axes, specifically rows and columns, allowing efficient data organisation and manipulation. It is similar to a spreadsheet or SQL table, where each column can hold different data types, and each row represents a unique record.
With a data frame, you can efficiently perform data selection, filtering, aggregation, and transformation operations. Its flexibility makes it an essential tool for data analysis in Python. Additionally, the DataFrame supports various input formats, including CSV, Excel, and SQL databases, streamlining the data import and export process.
Data Loading and Saving
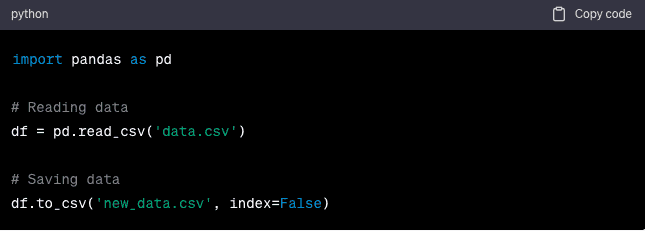
Pandas provides robust support for reading and writing data from various sources, including CSV files, Excel spreadsheets, SQL databases, etc. With just a few lines of code, you can quickly load data into a DataFrame, making it ready for analysis and manipulation.
The read_csv and read_excel functions allow you to import data from CSV and Excel files, while read_sql lets you retrieve data directly from SQL databases. Conversely, Pandas offers to_csv, to_excel, and to_sql functions to export your DataFrame back into these formats. This seamless data loading and saving capability makes Pandas a powerful data handling and analysis tool.
Data Selection and Indexing
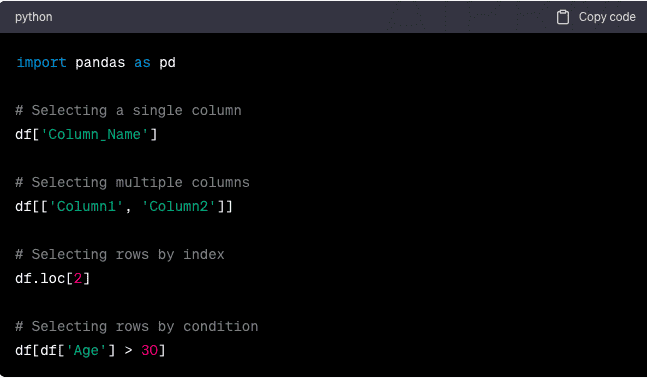
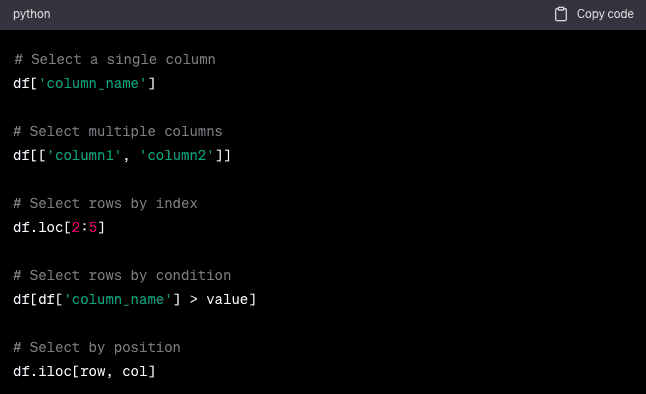
Pandas allow easy data selection using labels, indices, or a combination. This flexibility makes data manipulation straightforward and efficient. You can select data by specifying the row and column labels using methods like .loc[] for label-based indexing or .iloc[] for integer-based indexing.
Additionally, Pandas supports Boolean indexing, enabling you to filter data based on specific conditions. This feature is handy for large datasets where you need to extract relevant subsets quickly. Combining these indexing methods allows for powerful and precise data selection, enhancing your ability to analyse and manipulate data effectively.
Data Cleaning and Preprocessing
Data is rarely clean when initially collected, so data cleaning and preprocessing are crucial steps in data analysis. Pandas offers a comprehensive suite of tools to streamline this process. It lets you handle missing values by filling them in or dropping them from your dataset. You can also correct inconsistencies and errors, such as fixing typos or standardising formats.
Additionally, Pandas provides functionality for filtering out unnecessary data and transforming data types to ensure compatibility with your analysis requirements. These features enable you to prepare your data effectively, ensuring it is accurate and ready for insightful analysis.
Handling Missing Values
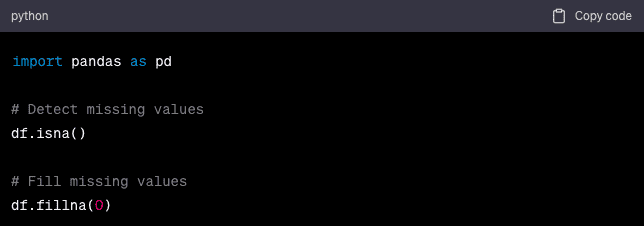
Pandas offers robust methods for detecting and handling missing values in datasets. The `isna()` function identifies missing or NaN values, returning a boolean DataFrame where `True` indicates a missing value. This function allows you to pinpoint where data gaps occur within your dataset.
Once you detect missing values, you can use the `fillna()` method to address them. This method enables you to replace missing values with specified values, such as the mean or median of the column, or forward-fill/backward-fill techniques to propagate existing values. These tools help maintain the integrity of your data and ensure accurate analysis.
Removing Duplicates
Duplicate records can distort your analysis by introducing redundancy and potentially skewing results. In Pandas, removing these duplicates is straightforward and efficient. The `drop_duplicates()` method lets you quickly identify and eliminate repeated entries from your DataFrame or Series. This method ensures that unique records remain, preserving the integrity of your dataset.
By eliminating duplicates, you maintain cleaner data, which leads to more accurate analysis and insights. Pandas’ approach to handling duplicates streamlines data preparation, enabling you to focus on extracting valuable information without worrying about redundant data inflating your results.
Data Transformation
Pandas facilitate a range of data transformations, enhancing data manipulation capabilities. You can sort data to organise it by specific criteria, filter it to focus on relevant subsets, and merge multiple datasets to combine information. These functions streamline data preparation, making analysing and extracting insights easier.
Sorting
In Pandas, sorting allows you to arrange your data based on column values, enhancing the organisation and readability of your dataset. By applying the sort_values() function, you can order the data in ascending or descending order according to the values in one or more columns. This process is crucial for analysing trends, identifying patterns, and preparing data for further analysis.
Sorting data helps you quickly locate specific records and ensures your dataset is structured according to your analytical needs. Whether you are arranging sales figures, dates, or any other metrics, sorting transforms raw data into a more insightful and manageable format.
Merging Data
Merging data in Pandas involves combining information from multiple DataFrames to create a unified dataset. This process allows you to integrate data from different sources, making it easier to analyse and draw insights. You can use merge techniques, such as inner, outer, left, and right, to control how data aligns between the DataFrames.
Specifying merge keys or indices ensures that related data points are accurately combined. This functionality is essential for data transformation tasks, as it helps consolidate data, fill gaps, and prepare it for further analysis or visualisation.
Grouping and Aggregation
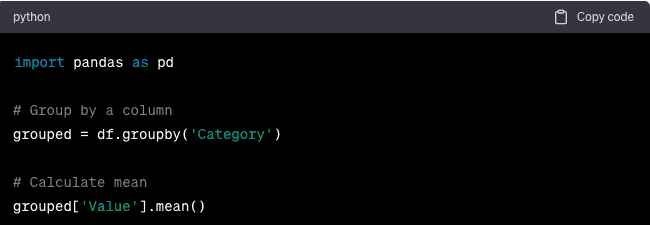
In Pandas, grouping data and performing aggregations are powerful features for data transformation. You can group data by one or more columns to create subsets based on shared attributes. This organisation allows you to perform aggregate functions such as sum, mean, and count on each group efficiently.
For example, you can group sales data by region, calculate total sales for each region, or group customer data by age range and compute average spending. These capabilities enable you to summarise and analyse large datasets effectively, making it easier to derive meaningful insights and make data-driven decisions.
Data Visualisation with Pandas
Pandas integrates seamlessly with data visualisation libraries like Matplotlib and Seaborn, allowing you to create insightful and customised charts. You can quickly plot data from DataFrames and Series, making visualising trends, distributions, and patterns easier. This integration enhances your ability to analyse and present data effectively.
Line Chart
Line charts are an effective tool for visualising trends over time or across continuous data points. You can easily create line charts using libraries like Matplotlib and Seaborn. By plotting data from a DataFrame or Series, you can observe patterns, fluctuations, and trends within your dataset.
These charts display data points connected by straight lines, making it simple to track changes and identify trends over a specified period. Line charts are handy for time series analysis, which can reveal underlying patterns and help forecast future values.
Bar Chart
Bar charts are a powerful way to represent categorical data, making comparisons between categories straightforward. In data visualisation with Pandas, you can easily create bar charts using libraries like Matplotlib and Seaborn. By plotting data from a DataFrame or Series, you can display each category’s frequency, count, or magnitude as distinct bars.
Each bar’s height represents the value associated with a category, allowing you to compare and contrast different data points quickly. Bar charts are handy for showing discrete data and visualising categorical comparisons, helping to uncover trends and insights within your dataset.
Tips and Best Practices
Consider these tips and best practices to get the most out of Pandas and ensure efficient data manipulation. Implementing these practices can enhance the performance and efficiency of your data analysis tasks, making your work with Pandas smoother and more effective.
- Optimise Memory Usage: Efficiently manage memory by using appropriate data types. For instance, convert large integer columns to smaller integer types if possible and use categorical data types for columns with limited unique values. This helps reduce memory consumption and improve performance.
- Use Vectorised Operations: Pandas’ vectorised operations speed up data processing. Vectorised operations allow you to simultaneously apply functions to entire columns or DataFrames, avoiding the need for explicit loops. This approach not only simplifies your code but also significantly accelerates execution time.
- Consult Documentation: Always refer to the official Pandas documentation for comprehensive and up-to-date information. The documentation provides detailed explanations of functions, parameters, and usage examples, which can help you better understand Pandas’ capabilities and troubleshoot any issues you may encounter.
Pandas Cheat Sheet
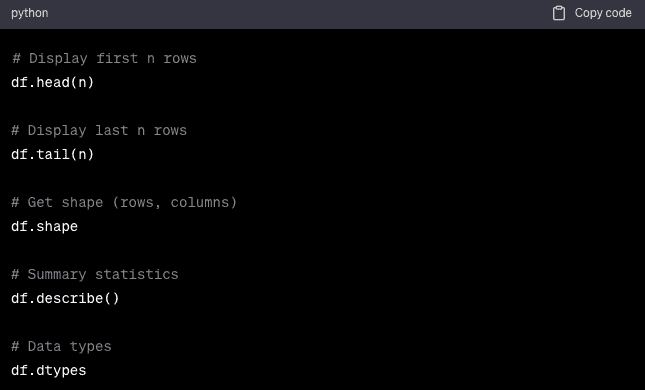
Here’s a concise Pandas cheat sheet tailored for interviews. This cheat sheet covers some key Pandas concepts and commands that are often relevant during interviews:
Importing Pandas
Reading Data
Basic Operations
Selection and Indexing
Filtering Data
Data Visualization
Pandas Cheatsheet GitHub
If you’re looking for a Pandas cheat sheet on GitHub, you can find a variety of Pandas cheat sheets and resources shared by the community. Here’s how you can search for Pandas cheat sheets on GitHub:
- Go to the GitHub website (https://github.com).
- In the GitHub search bar, type “Pandas cheat sheet” or “Pandas cheat sheet” and press Enter.
- Browse through the search results to find Pandas cheat sheets and related resources. You can also use filters on the search results page to narrow your search, such as filtering by repositories, issues, or topics.
- Click on a repository or resource that interests you to access the Pandas cheat sheet and related content. GitHub repositories often include Jupyter notebooks, Markdown files, or PDFs that contain Pandas cheat sheets and tutorials.
- You can download, fork, or contribute to the repositories as needed.
Read More: What are the Best Data Science Projects on GitHub?
Frequently Asked Questions
What is a Pandas cheat sheet?
A Pandas cheat sheet is a concise reference guide that outlines essential commands and functions for using the Pandas library in Python. It simplifies data manipulation tasks such as loading, cleaning, transforming, and visualising data, helping beginners and experienced users streamline their workflows.
How can I use Pandas for data visualisation?
Pandas integrates with libraries like Matplotlib and Seaborn to facilitate data visualisation. By plotting data from DataFrames and Series, you can create various charts, such as line and bar charts, to analyse trends, distributions, and comparisons, thus making your data insights more accessible and interpretable.
Where can I find Pandas cheat sheets?
Pandas cheat sheets are widely available on GitHub. Search for “Pandas cheat sheet” on the GitHub website to find them. You can browse through repositories containing Jupyter notebooks, Markdown files, or PDFs, which provide comprehensive guides and examples of Pandas functions and commands.
Closing Thoughts
Mastering Pandas is crucial to becoming proficient in data analysis and manipulation. Pandas’ extensive data handling, cleaning, and analysis capabilities can unlock a world of insights.
This comprehensive Pandas cheat sheet for Data Science covers the fundamental aspects of Pandas, giving you the tools to surpass the competition and become an expert in data management and analysis.


