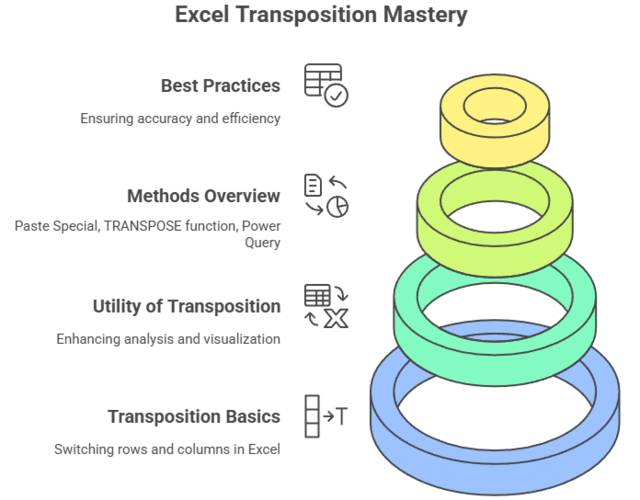
Summary: Transpose in Excel is the process of switching rows to columns or columns to rows, making data analysis and presentation more flexible. This guide covers all the main methods—Paste Special, TRANSPOSE function, Power Query, and VBA—so you can choose the best way to convert your data layout quickly and efficiently.
Introduction
Transposing data in Excel is an essential skill for anyone who works with spreadsheets. Whether you need to switch rows to columns for better analysis, reporting, or visualization, Excel offers several built-in methods to help you do this quickly and accurately.
In this comprehensive guide, we’ll explore what transposing means, why it’s useful, and step-by-step instructions for every major method, including best practices and troubleshooting tips.
Key Takeaways
- Excel offers multiple ways to transpose rows and columns for flexible data management.
- Paste Special is the fastest way for static, one-time data transposition.
- The TRANSPOSE function keeps your transposed data linked and updated automatically.
- Power Query is ideal for large, complex, or frequently updated datasets.
- Always double-check your ranges and formatting after transposing data for best results.
What Does Transpose Mean in Excel?
Transposing in Excel refers to rotating your data so that rows become columns and columns become rows. This process maintains all your original information but changes its orientation, making it easier to analyse or present data in a different format.
Imagine you have a list of sales figures arranged horizontally across a row, but you want to see them vertically in a column to better compare with other data sets. Transposing makes this switch effortless.
Why Transpose Data in Excel?
Transposing data in Excel is important because it allows you to reorganize your dataset by switching rows to columns or columns to rows, which can significantly enhance data analysis, reporting, and visualization. This reorientation helps present data more clearly and makes it easier to identify patterns, trends, and relationships within the data.
For example, in data analytics, transposing can convert a table where sales quarters are listed as rows and countries as columns into a format where countries become rows and quarters become columns. This switch makes it easier to compare performance across countries and visualize which regions are generating the most revenue.
Additionally, transposing saves time and reduces errors by eliminating the need to manually re-enter or copy-paste data when a different layout is required. It is especially useful when you receive data in a format that is not ideal for your analysis or reporting needs, allowing you to quickly reshape the data to fit your requirements without losing any information.
In practical terms, transposing is valuable for:
- Preparing data for PivotTables or charts that require a specific orientation.
- Organizing data so each row represents a subject and each column a variable, which is a best practice for analysis.
- Facilitating easier comparison of data points, such as sales figures across products or time periods.
- Adjusting poorly formatted data into a more usable structure without retyping or extensive manual work.
Main Methods to Transpose in Excel
Excel offers several effective methods to transpose data, each with unique strengths and best-use scenarios. The three main methods are:
Paste Special
The quickest and simplest way to transpose data for a one-time, static conversion.
- How it works: Select your data, copy it, right-click the destination cell, choose “Paste Special,” check the “Transpose” box, and click OK.
- When to use: Ideal for quick, one-off tasks where the transposed data does not need to update if the source changes.
- Advantages: Fast, easy, no formulas required.
- Limitations: Creates a static copy; changes in the original data won’t reflect in the transposed version.
TRANSPOSE Function
A dynamic formula-based approach that keeps the transposed data linked to the original.
- How it works: Select the destination range, enter =TRANSPOSE(range) (e.g., =TRANSPOSE(A1:D4)), and press Enter (or Ctrl+Shift+Enter in older Excel versions).
- When to use: Best for situations where the source data may change and you want the transposed data to update automatically.
- Advantages: Maintains a live link to the original data; updates automatically.
- Limitations: Requires careful selection of the output range; formatting is not preserved; can be confusing for beginners.
Power Query
An advanced method for transposing large or complex datasets, especially useful when additional data transformation is needed.
- How it works: Load your data into Power Query from the Data tab, use the Transpose option in the Transform ribbon, then load the result back into Excel.
- When to use: Recommended for large datasets, repetitive tasks, or when you need to automate and combine multiple data transformations.
- Advantages: Handles large data efficiently, allows for additional transformations, and can be refreshed when the source data changes.
- Limitations: More steps and a steeper learning curve; opens a separate editor window.
These methods ensure flexibility, whether you need a simple, static switch or a dynamic, update-ready solution for your data in Excel.
Example on Convert Rows to Columns Easily
Here’s a simple example demonstrating how to convert rows to columns easily in Excel using the Paste Special Transpose method.
Example: Convert Rows to Columns Easily
Scenario:
You have the following data arranged in a row (Row 1):
- A1: Product
- B1: Sales Q1
- C1: Sales Q2
- D1: Sales Q3
You want to convert this horizontal row into a vertical column starting from cell A3.
Step-by-Step:
Step 1: Select the row data
Highlight cells A1 to D1.
Step 2: Copy the selection
Press Ctrl + C or right-click and choose “Copy.”
Step 3: Select the destination cell
Click on cell A3 where you want the column to start.
Step 4: Open Paste Special
Right-click on cell A3, then select “Paste Special.”
Step 5: Transpose the data
In the Paste Special dialog box, check the “Transpose” option.
Step 6: Click OK
The data from the row will now appear vertically in cells A3 to A6.
Result
Conclusion
In conclusion, transposing data in Excel is a vital skill that enhances data flexibility and presentation. Whether you choose the quick Paste Special method, the dynamic TRANSPOSE function, or the powerful Power Query tool, each approach offers unique benefits tailored to different needs.
Mastering these methods empowers you to efficiently reorganize your data, improve analysis, and streamline reporting. By selecting the right technique, you can save time, reduce errors, and make your Excel workflows more effective and professional.
Frequently Asked Questions
What Does Transpose Mean in Excel?
Transposing in Excel means converting rows to columns and columns to rows, rotating your data’s orientation while keeping all information intact.
Does Transposed data Update if the Source Changes?
Only if you use the TRANSPOSE function. Paste Special creates a static copy, while Power Query requires a manual refresh to update the data.
Can I Transpose Only a Specific Part of My Spreadsheet?
Yes, simply select the specific range you want to transpose before using any method. This allows you to restructure only the desired data.


