Summary: Discover key data cleaning techniques in Excel to ensure accurate insights. Learn how to handle missing data, remove duplicates, correct inconsistencies, and format data effectively. Improve your data quality, enhance analysis, and make better decisions.
Introduction
Most of our decisions are a result of data-driven approach. Raw data, however, is rarely perfect. It often arrives messy, inconsistent, and riddled with errors. This “dirty” data can lead to flawed analysis, inaccurate reports, and ultimately, poor decision-making. This is where data cleaning in Excel becomes an indispensable skill.
Microsoft Excel, while often seen as a simple spreadsheet tool, offers a powerful suite of features specifically designed to help you wrangle unruly datasets into shape. Mastering Excel data cleaning techniques is crucial for anyone working with data, from business analysts and researchers to students and marketers.
This comprehensive guide will walk you through the importance of data cleaning and explore essential techniques you can implement directly within Excel to ensure your data is accurate, consistent, and ready for reliable analysis.
Key Takeaways
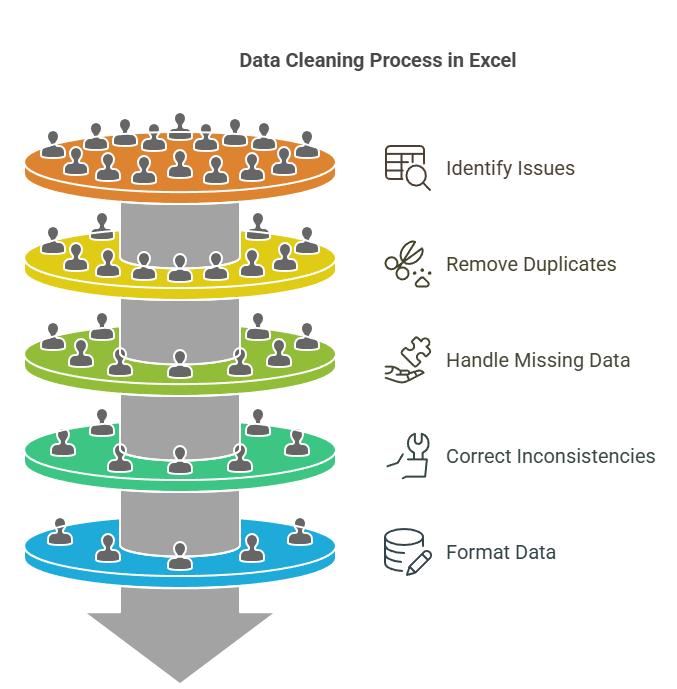
- Identify and remove duplicate entries to ensure data accuracy.
- Handle missing data appropriately to avoid analysis errors.
- Correct inconsistencies for reliable and valid data insights.
- Format data correctly for effective analysis and visualization.
- Improve decision-making with cleaned, high-quality Excel data.
Why is Data Cleaning So Crucial?

Before diving into the “how,” let’s solidify the “why.” Ignoring data cleaning can have significant negative consequences:
- Inaccurate Analysis & Reporting: Garbage in, garbage out. If your source data contains errors (like typos, duplicates, or incorrect values), any analysis or report derived from it will be fundamentally flawed.
- Poor Decision-Making: Businesses rely on data insights to guide strategy. Decisions based on inaccurate data can lead to wasted resources, missed opportunities, and strategic missteps.
- Reduced Efficiency: Working with messy data slows down processes. Analysts spend excessive time trying to fix issues manually or work around inconsistencies instead of focusing on deriving insights.
- Damaged Credibility: Presenting reports based on unclean data can erode trust among stakeholders, colleagues, and clients.
- Integration Problems: When combining datasets from different sources, inconsistencies in formatting or naming conventions can make integration difficult or impossible.
Conversely, investing time in data cleaning using Excel yields substantial benefits:
- Enhanced Accuracy: Ensures calculations, summaries, and visualisations reflect the true picture.
- Improved Decision-Making: Provides a solid foundation for confident, data-backed choices.
- Increased Efficiency: Streamlines analysis processes by removing roadblocks caused by errors.
- Greater Reliability & Trust: Builds confidence in your data and the insights derived from it.
Common Data Quality Issues You’ll Encounter in Excel
Understanding the typical problems helps you know what to look for:
- Duplicate Records: The same entry appearing multiple times, skewing counts and sums.
- Typos and Misspellings: Inconsistent text entries (e.g., “New York” vs. “New Yorkk” vs. “NY”).
- Extra Spaces: Leading, trailing, or excessive spaces within cells that disrupt sorting, filtering, and lookups (e.g., ” Product A ” vs. “Product A”).
- Inconsistent Formatting: Dates entered in different formats (MM/DD/YY, DD-MMM-YYYY), numbers stored as text, varying capitalization.
- Missing Values: Blank cells where data should exist.
- Structural Errors: Merged cells that interfere with sorting/filtering, data spread across multiple columns when it should be in one.
- Outliers: Values that are significantly different from the rest, potentially due to entry errors.
- Mixed Data Types: Numbers and text mixed within the same column intended for calculations.
Essential Data Cleaning Techniques in Excel
Data cleaning is crucial to ensure accuracy in prediction. There are several techniques to remove inaccurate data. Here we will be exploring the practical Excel data cleaning techniques you can use to tackle these issues:
Removing Duplicate Records
Duplicates are one of the most common data quality problems. Excel provides a straightforward tool to eliminate them.
- Why: Prevents inflated counts, inaccurate averages, and skewed analysis.
- How:
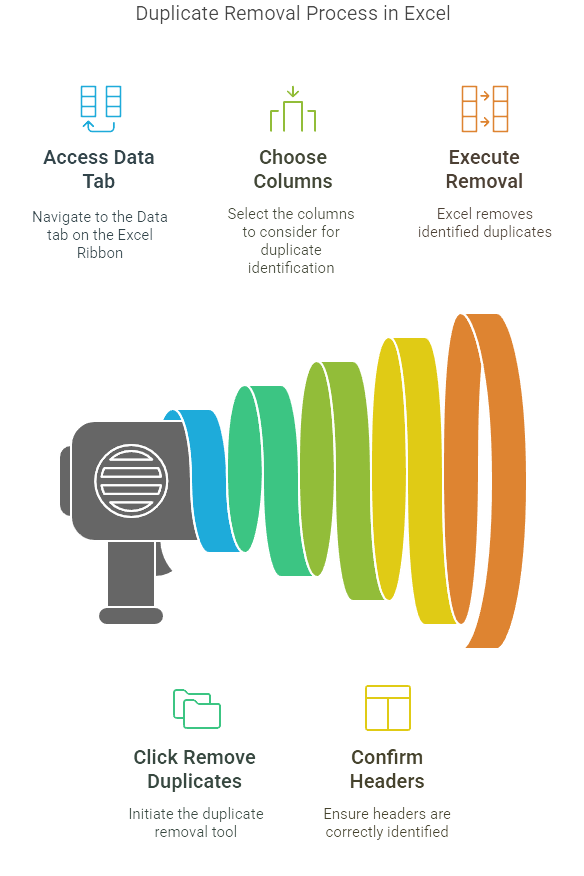
- Select the range of cells or the entire table where you want to remove duplicates.
- Go to the Data tab on the Ribbon.
- In the Data Tools group, click Remove Duplicates.
- In the dialog box, check the columns you want Excel to consider when identifying duplicates. If your data has headers, ensure “My data has headers” is checked.
- Click OK. Excel will report how many duplicates were found and removed.
- Tip: Always consider why duplicates exist. Sometimes they are legitimate, representing multiple transactions for the same customer, for example. Ensure you’re only removing truly redundant entries. It’s often wise to work on a copy of your data.
Trimming Extra Spaces (The TRIM Function)

Hidden spaces are notorious for causing matching errors and lookup failures (like VLOOKUP).
- Why: Extra spaces (leading, trailing, or multiple spaces between words) make text strings unique, even if they look identical to the human eye. This breaks formulas and sorting.
- How: Use the TRIM() function.
- Insert a new helper column next to the column with extra spaces.
- In the first cell of the helper column, enter the formula =TRIM(A2) (assuming your messy data is in cell A2).
- Drag the fill handle down to apply the formula to all relevant rows.
- Once done, select the entire helper column, copy it (Ctrl+C), then select the original column, right-click, choose Paste Special, and select Values. This replaces the original data with the cleaned, space-free version.
- You can now delete the helper column.
Standardizing Text Case (LOWER, UPPER, PROPER Functions)

Inconsistent capitalization (e.g., “usa”, “USA”, “Usa”) can prevent proper grouping and analysis.
- Why: Ensures text entries are treated consistently for sorting, filtering, and matching.
- How: Use text functions in a helper column, similar to the TRIM method:
- =LOWER(A2): Converts all text to lowercase (e.g., “usa”).
- =UPPER(A2): Converts all text to uppercase (e.g., “USA”).
- =PROPER(A2): Capitalizes the first letter of each word (e.g., “United States”).
- Choose the function that best suits your standardization needs, apply it in a helper column, and then use Paste Special > Values to replace the original data.
Using Find and Replace for Consistency
This tool is invaluable for correcting common typos or standardizing terms across your dataset.
- Why: Quickly corrects widespread errors or enforces consistent terminology (e.g., changing all instances of “St.” to “Street”).
- How:
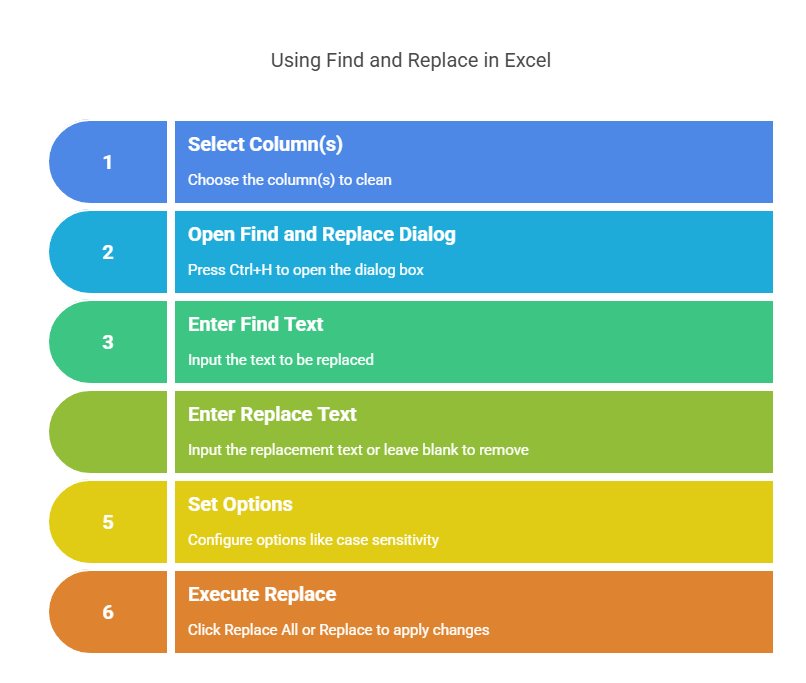
- Select the column(s) or range you want to clean.
- Press Ctrl+H to open the Find and Replace dialog box.
- In the “Find what” field, enter the text you want to replace (e.g., “N/A”).
- In the “Replace with” field, enter the correct text or leave it blank to remove the text.
- Click Options >> for more control:
- Match case: Makes the search case-sensitive.
- Match entire cell contents: Ensures only cells containing exactly the “Find what” text are replaced. This is crucial to avoid unintended changes (e.g., replacing “St” within “Street”).
- Click Replace All (use with caution – perhaps use Find Next and Replace initially) or Replace.
- Tip: Use this iteratively for different corrections. Be very specific, especially when using “Replace All.”
Splitting Data with Text to Columns
Sometimes data is crammed into a single cell when it should be separated (e.g., “First Name Last Name” or comma-separated values).
- Why: Separates combined data into distinct columns for better analysis and organisation.
- How:
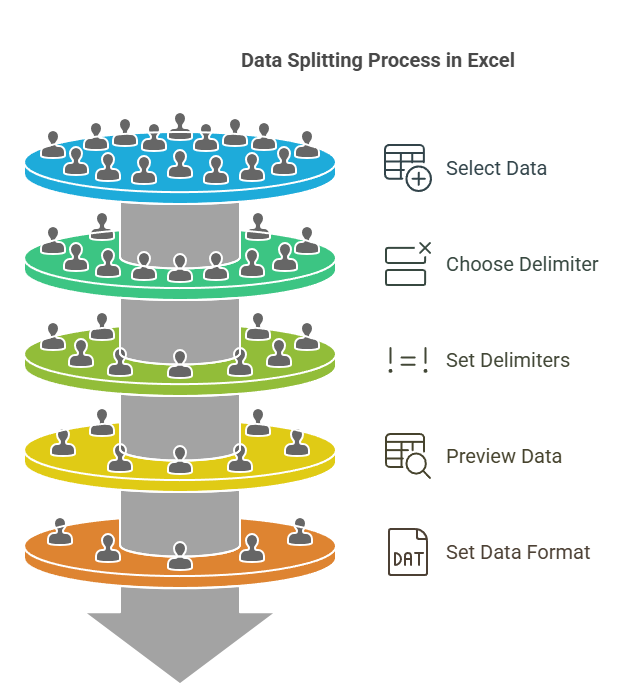
- Select the column containing the data you want to split.
- Go to the Data tab and click Text to Columns in the Data Tools group.
- Choose Delimited if your data is separated by characters like commas, tabs, or spaces. Choose Fixed width if the data is aligned in columns with spaces between fields.
- If Delimited: Click Next, select the delimiter(s) (e.g., Space, Comma), and check the data preview. Click Next.
- If Fixed Width: Click Next, set the column break lines in the preview by clicking where you want to split. Click Next.
- In the final step, you can set the data format for each new column (General, Text, Date) and specify the destination for the split data (ensure there are enough empty columns to the right).
- Click Finish.
Handling Blank Cells

Missing data needs attention, as blanks can disrupt calculations and analysis.
- Why: Blank cells can cause errors in formulas (e.g., division by zero) or skew averages if not handled appropriately.
- How:
- Select the range where you want to find blanks.
- Press F5 (or Ctrl+G) to open the Go To dialog, then click Special….
- Select Blanks and click OK. All blank cells in your selection will be highlighted.
- Now, you can decide how to handle them:
- Enter a value: Type a value (like 0, “N/A”, or “Unknown”) and press Ctrl+Enter to fill all selected blank cells simultaneously.
- Delete Rows: Right-click on a selected blank cell and choose Delete… -> Entire row. Use this with extreme caution, as it removes the entire record. Ensure this is appropriate for your analysis.
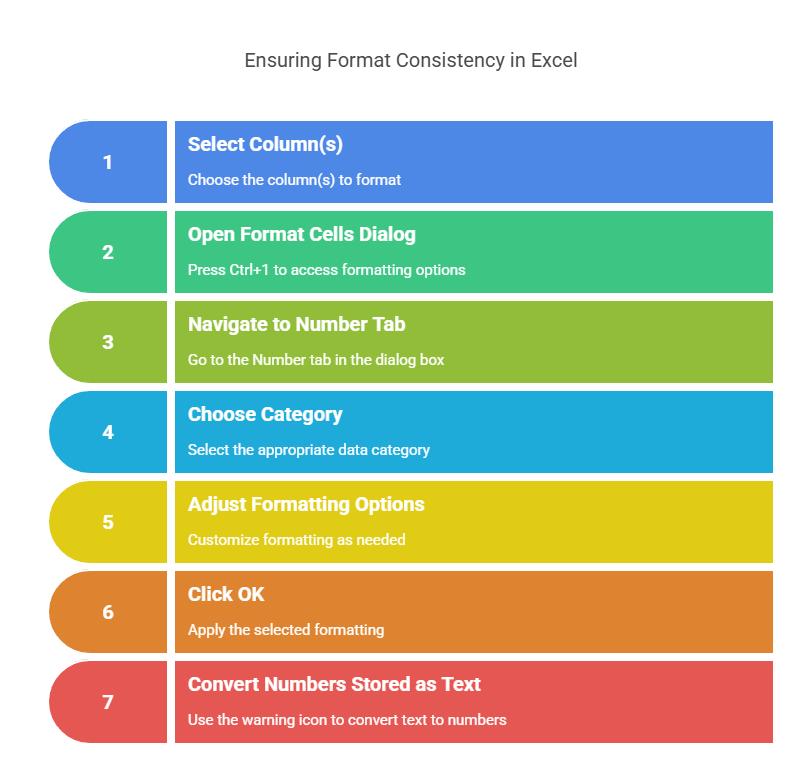
Ensuring Format Consistency (Numbers, Dates, Text)
Inconsistent data types (e.g., numbers stored as text) can prevent calculations and cause sorting issues.
- Why: Ensures Excel interprets data correctly for calculations, sorting, and filtering.
- How:
- Select the column(s) needing formatting.
- Press Ctrl+1 to open the Format Cells dialog box.
- Go to the Number tab.
- Choose the appropriate category (e.g., Number, Currency, Date, Text).
- Adjust specific formatting options as needed (e.g., decimal places, date format).
- Click OK.
- Tip for Numbers Stored as Text: Sometimes you’ll see a small green triangle indicating a number stored as text. Select these cells, click the warning icon, and choose Convert to Number.
Conclusion: Clean Data is the Foundation
Data cleaning in Excel isn’t just a preliminary chore; it’s a foundational step for extracting meaningful and reliable insights. By mastering techniques like removing duplicates, trimming spaces, standardizing formats, and utilizing Find and Replace effectively, you transform raw, messy data into a valuable asset.
While Excel offers powerful tools, remember that the best approach often involves a combination of these techniques tailored to your specific dataset’s issues. Regularly practicing Excel data cleaning builds not only your technical skills but also your confidence in the data you work with.
Frequently Asked Questions
What’s The Very First Step I Should Take When Cleaning Data In Excel?
Always start by understanding your data and identifying potential issues. Make a backup copy of your original file before applying any cleaning steps. This ensures you can revert to the original data if something goes wrong during the cleaning process. Exploration precedes correction.
Can Excel Handle Cleaning Very Large Datasets Effectively?
Excel can handle moderately large datasets. However, for very large files (hundreds of thousands or millions of rows) or complex, multi-step cleaning processes, performance can degrade. In such cases, using Power Query (Get & Transform Data) within Excel is highly recommended for better performance and automation.
How Often Should I Perform Data Cleaning?
It depends on the data source and frequency of updates. Best practice is to clean data as soon as it’s imported or entered, and always before conducting any significant analysis or reporting. For recurring datasets, setting up automated cleaning steps using Power Query is most efficient.
Authors
-

Written by:
Neha SinghReviewed by: