Summary: Discover advanced SQL tips to enhance your database management skills. Learn subqueries, window functions, CTEs, indexing, and optimisation strategies to improve performance and simplify queries. Master techniques like PIVOT, recursive CTEs, JSON functions, and dynamic SQL for efficient data handling. Unlock powerful insights and streamline your SQL workflow today!
Introduction
Structured Query Language (SQL) is a fundamental programming language designed for managing and manipulating data within relational databases. It plays a crucial role in a Data Analyst’s toolkit. Hence, it enables users to perform essential tasks such as filtering, sorting, aggregating, and executing complex calculations on large datasets.
Mastery of SQL is vital for newcomers and experienced professionals in the field. This blog explores advanced SQL techniques and best practices. You will be offered valuable tips and tricks to enhance your data-handling capabilities. By leveraging these strategies, you’ll streamline your data analysis processes and extract more meaningful insights from your data.
Key Takeaways
- Use indexing, subqueries, and CTEs for efficient query performance.
- Perform advanced calculations without collapsing rows.
- Use PIVOT, JSON functions, and dynamic SQL for flexible data handling.
- Common Table Expressions (CTEs) simplify complex queries.
- Correlated subqueries and LAG/LEAD functions enable precise data analysis.
Subqueries for filtering data
Subqueries in SQL are potent tools that help programmers establish nested relationships between different attributes. One of the most common uses of subqueries is to filter data based on conditions.
Suppose you have a table of sales transactions and want to find all customers who purchased in the last 30 days. You can use a subquery to filter the data and return only those customers.
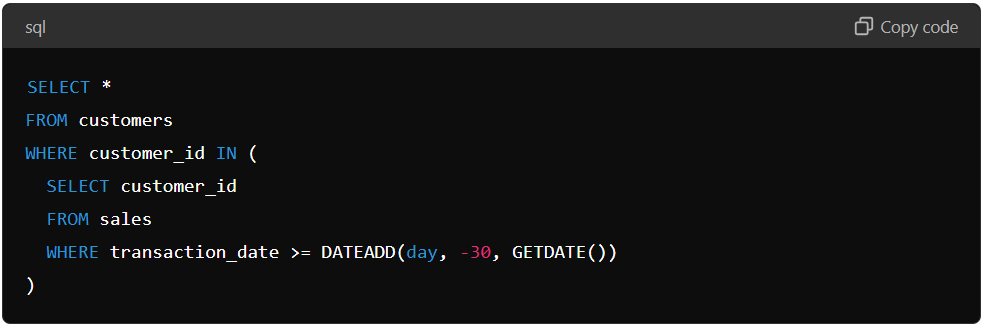
The inner query selects all the customer IDs from the sales table whose transaction date is within the last 30 days. The outer query then selects all the customer information from the customer’s table whose customer ID is in the list the inner query returns.
Calculations using the WINDOW function
The window function in SQL is a high-end coding feature that allows users to extract a particular Data table window to perform organisable calculations such as moving averages or cumulative sums directly on the database.
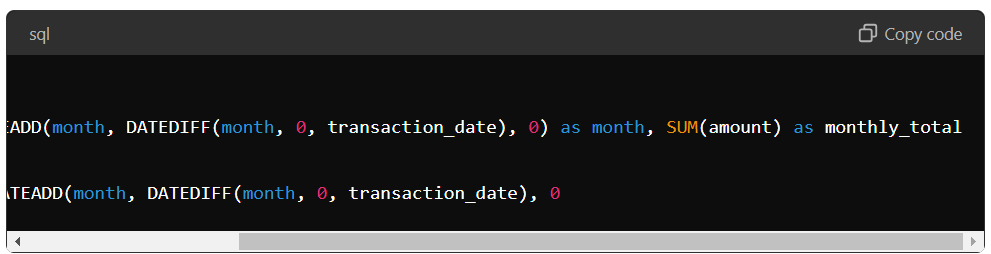
For example, suppose we have a table of sales transactions and want to calculate each product’s sales sum by month. We can use the WINDOW function to calculate the sum for each product over a one-month window.
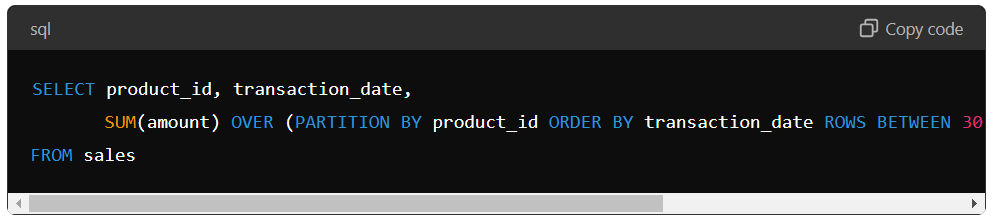
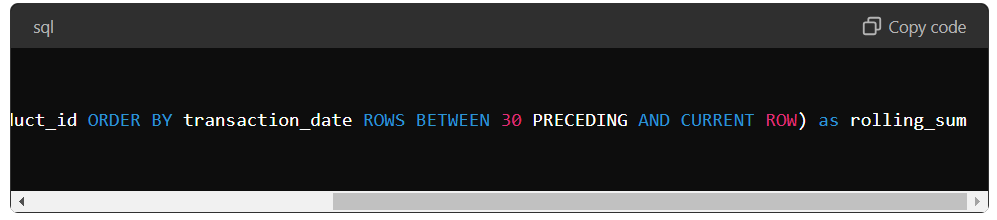
Here, the window function calculates the sum of the amount feature over a window of 30 preceding rows and the current row, separated by the product ID and ordered by the transaction date.
Read Blog: Overview of ROW_NUMBER Function in SQL.
Common Table Expressions for Readability
CTEs define a temporary table inside an existing table within a query, allowing the user to disintegrate the table into more manageable and practical pieces. Consider we have a table of sales transactions and want to calculate the total sales by month and year for each product.
You can use a CTE to calculate the monthly sales for each product and then join it with a second CTE to estimate the yearly sales.
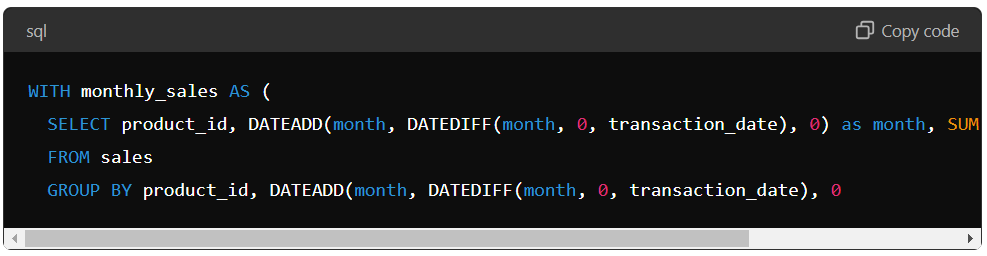
First, CTE calculates the monthly sales for each product by grouping the data by product ID and the start of the month. Then, CTE calculates the yearly sales for each product by grouping the monthly sales by product ID and year.
The final query then selects all the columns from the annual sales CTE.
Correlated Sub-queries for Complexing Filtering
Correlated subqueries are subqueries linked to the outer query through a shared column. They help perform complex filtering, such as selecting the top N records within a group or finding records matching a specific condition.
Suppose we have a table of sales transactions and want to see the top 10% of customers based on their total purchase amount. We can use a correlated subquery to calculate the total purchase amount for each customer and then filter the data to return only the top 10% of customers.
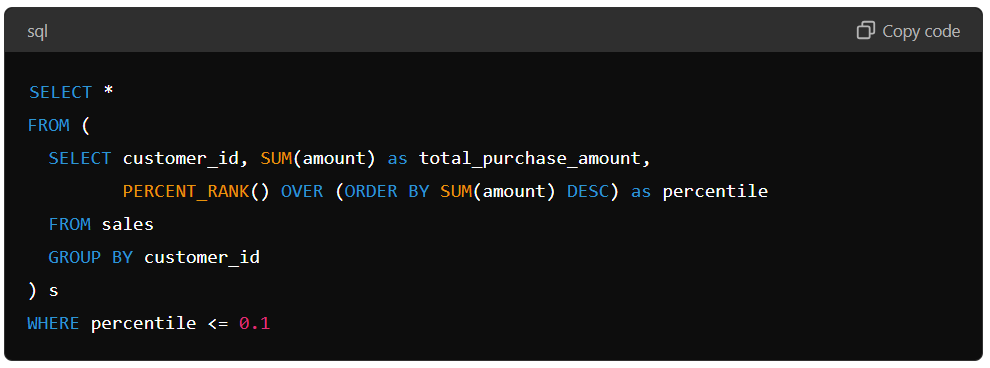
The query uses the PERCENT_RANK function to calculate each customer’s percentile rank based on their purchase amount. The outer query then filters the data to return only the top 10% of customers.
LAG & LEAD
Let’s say you have a table that contains sales data for a retail store over the last few years. You want to analyse the sales trends over time and determine if there are any patterns or anomalies in the data.
One way to do this is to use the Lag and Lead functions in SQL. These functions allow you to access data from previous or future rows in the same table.
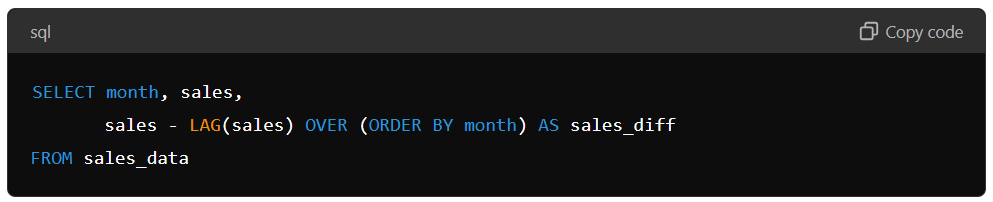
The Lag function returns the value of a specified column from the previous row in the table. For example, if you want to calculate the difference in sales between each month, you can use the Lag function to subtract the sales from the previous month from the current month.
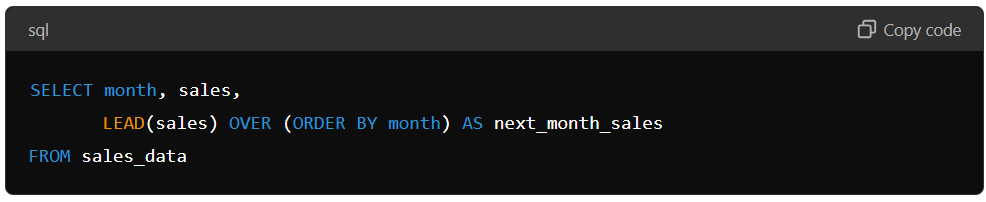
The Lead function works similarly, but instead of accessing data from previous rows, it returns data from future rows. For example, if you want to predict sales for the next month based on the current month’s sales, you can use the Lead function to access the sales data from the next month.
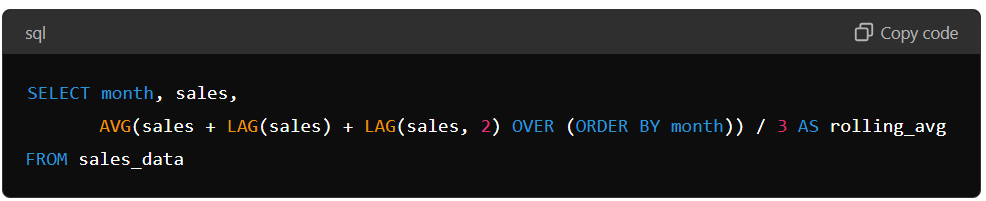
Lag and Lead functions can also calculate moving averages or other rolling calculations. For example, if you want to calculate a 3-month rolling average of sales data, you can use the Lag function to access the sales data from the previous two months and then calculate the average.
Use of Index for Faster Queries
An index is a data structure that allows fast retrieval of rows from a table based on the values in one or more columns. By creating indexes on frequently used columns, you can significantly reduce the time it takes to retrieve data from the database.
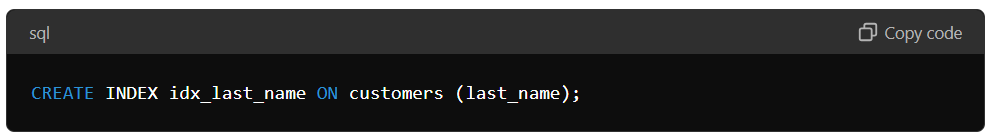
If you frequently need to retrieve customer information based on their last name, you could create an index on the “last_name” column. This would allow the database to locate rows matching the search criteria without scanning the table. You can use the CREATE INDEX statement to create an index in SQL.
However, it’s important to note that indexes come with some trade-offs. While they can improve query performance, they also require additional storage space and can slow down data updates and inserts. Therefore, it’s essential to carefully consider which columns to index and how many indexes to create.
Recursive CTEs for Hierarchical Data
Recursive Common Table Expressions (CTEs) help query hierarchical data such as organisational charts, product categories, or file directories. They allow you to iterate through rows using a recursive query structure.
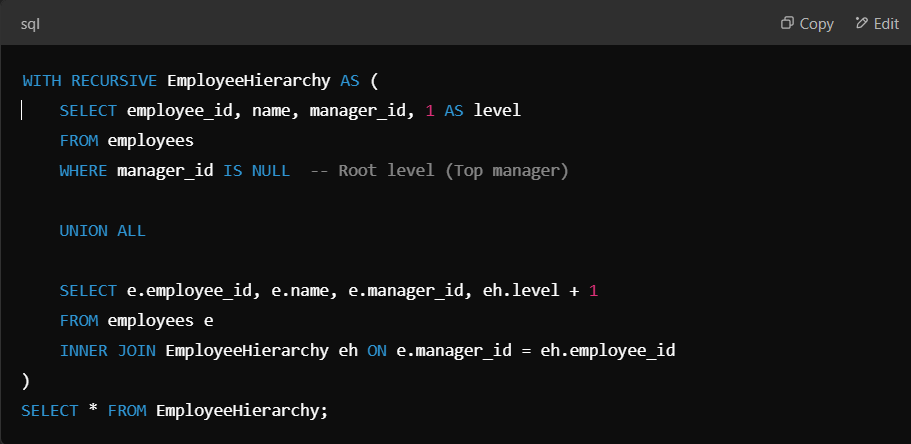
Suppose you have an employees table with a self-referencing manager_id column. You can use a recursive CTE to retrieve an entire reporting hierarchy for a given manager.
JSON Functions for Handling Semi-Structured Data
Modern databases like PostgreSQL and MySQL support JSON functions to store and manipulate semi-structured data inside relational tables. You can extract values, search inside JSON objects, and even aggregate data.
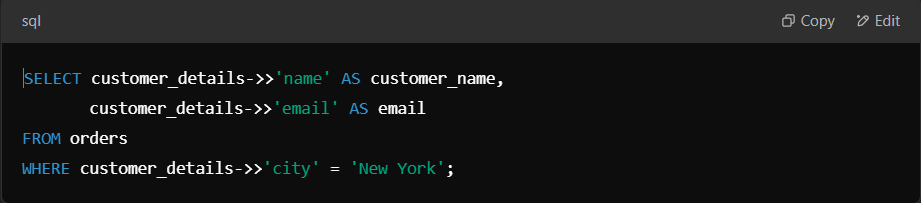
Suppose you store customer data in a jsonb column (customer_details) in PostgreSQL. You can extract and filter data using JSON functions.
Dynamic SQL for Flexible Queries
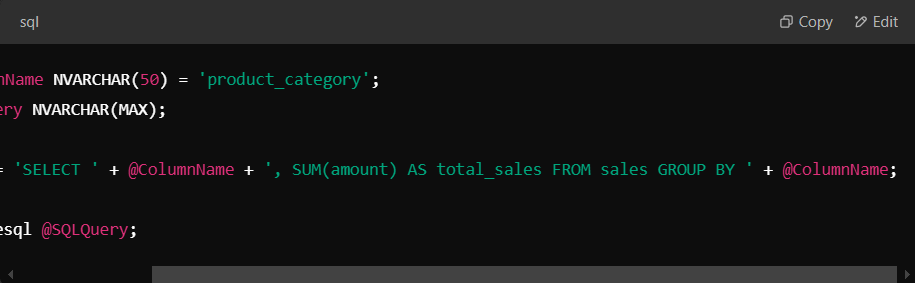
Dynamic SQL allows you to construct and execute SQL statements at runtime, making it useful when query parameters change dynamically. In SQL Server, you can use EXECUTE or PREPARE statements in PostgreSQL or sp_executesql.
Let’s take an example of generating a dynamic query to filter sales data based on a user-defined column name.

Pivoting Data with PIVOT Operator
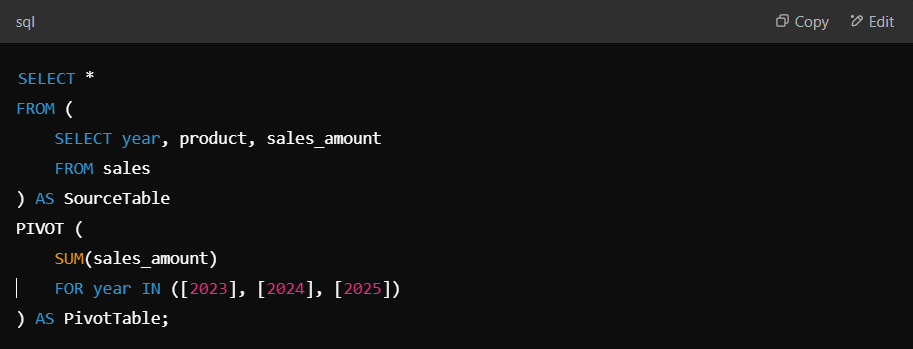
The PIVOT function allows you to transform rows into columns, making it easier to analyse categorical data in a structured format.
Suppose you have a sales table with year, product, and sales_amount. You can pivot the data to display sales per product for different years.
Batch Updates Using CASE Statements
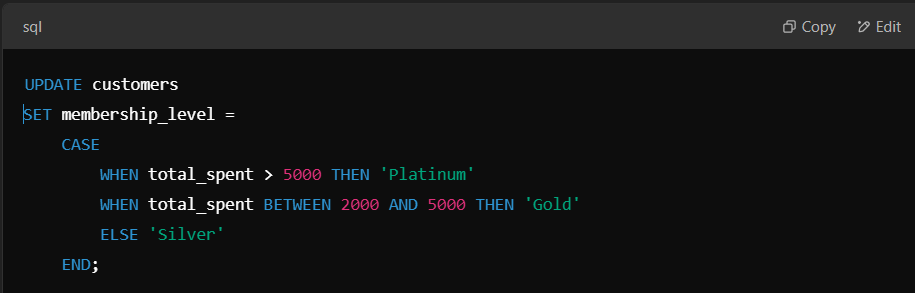
Instead of executing multiple UPDATE statements, you can use a CASE statement within an UPDATE query to update multiple records efficiently.
Let’s take an example of updating customer membership levels based on total spending.
Further Explore Blogs:
8 Best Books for SQL For Beginners and Advanced Learners.
SQL Interview Questions for Data Analysts in 2024.
In Closing
Mastering advanced SQL tips significantly enhances data analysis and database management. Techniques like subqueries, window functions, CTEs, and indexing improve query performance and readability. Functions such as LAG, LEAD, and PIVOT empower analysts to derive deeper insights.
Optimising queries using indexing and recursive CTEs enhances efficiency. JSON functions and dynamic SQL provide flexibility in handling complex data. By applying these advanced SQL techniques, professionals can streamline data workflows.
They can also optimise query execution and uncover valuable insights. Whether you’re a data analyst or database developer, leveraging these strategies will help you manage and analyse data more effectively and efficiently.
Frequently Asked Questions
What are the Most Useful Advanced SQL Techniques for Data Analysis?
Advanced SQL techniques like subqueries, window functions, CTEs, indexing, and PIVOT improve data analysis efficiency. They help filter, aggregate, and structure data effectively, enhancing database performance and simplifying complex queries for better insights.
How do Window Functions Enhance SQL Query Performance?
Window functions allow calculations across a specific dataset window without collapsing rows. They help compute moving averages, ranking, and cumulative sums, making SQL queries more efficient and eliminating the need for complex self-joins.
Why is Indexing Important in SQL, and how does it Improve Query Speed?
Indexing speeds up data retrieval by organising database columns for quick access. Properly indexed tables reduce query execution time, improve performance, and optimise searches, but excessive indexing can impact insert/update operations due to maintenance overhead.
Authors
-

Written by:
Neha SinghReviewed by: