Summary: Kurtosis in statistics quantifies the heaviness of a distribution’s tails, revealing the likelihood of extreme values or outliers. It is vital for risk assessment, especially in finance and quality control, as it distinguishes between normal, heavy-tailed, and light-tailed distributions, guiding data-driven decisions and enhancing analytical accuracy.
Introduction
Imagine standing at the base of two mountains. One has a sharp peak with steep slopes, while the other is broad and flat. Just as these shapes tell different stories about geological forces, kurtosis reveals how data clusters around its mean and spreads into the “tails” of a distribution.
In statistics, kurtosis measures the “tailedness” of data-how prone a dataset is to produce extreme values compared to a normal distribution. For example, stock market returns often exhibit “fat tails,” meaning unexpected crashes or rallies occur more frequently than a normal bell curve would predict.
Key Takeaway
- Kurtosis measures the “tailedness” or extremity of data distributions.
- Three types: mesokurtic, leptokurtic, and platykurtic distributions exist.
- High kurtosis signals more frequent and severe outliers in data.
- Essential for risk assessment in finance, quality control, and analytics.
- Kurtosis differs from skewness, focusing on tails, not symmetry
Types of Kurtosis
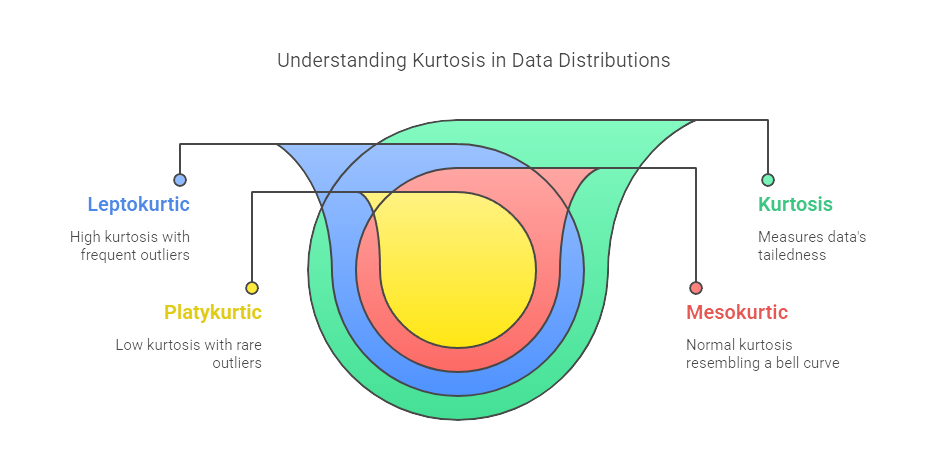
Kurtosis in statistics describes the “tailedness” of a data distribution, indicating how prone a dataset is to outliers compared to a normal distribution. There are three main types of kurtosis, each reflecting a different tail behavior and risk profile:
Mesokurtic (Normal Kurtosis)
A mesokurtic distribution (excess kurtosis = 0) matches the tail thickness of a normal distribution. Most data in nature, like human height, follow this pattern.
Leptokurtic (High Kurtosis)
Leptokurtic distributions (excess kurtosis > 0) have heavier tails and a sharper peak. Financial returns often show this trait, as extreme market swings are more common than a normal distribution predicts.
Platykurtic (Low Kurtosis)
Platykurtic distributions (excess kurtosis < 0) have thinner tails and a flatter peak. Examples include standardized test scores, where extreme results are rare.
How to Calculate Kurtosis
Kurtosis is calculated using the fourth standardized moment of a distribution. For a population, the formula is:

Alt text: Image showing the formula of Kurtosis
Where:
- μ4μ4 = Fourth central moment (average of deviations from the mean, raised to the fourth power)
- σσ = Standard deviation
For sample data, an unbiased estimator adjusts for sample size (nn):

Tools like Excel’s KURT() function automate this calculation, which is prone to manual error.
Importance of Kurtosis in Data Analysis

Kurtosis in statistics is a vital measure for understanding the shape and behavior of data distributions, particularly their tails, which represent the likelihood of extreme values or outliers. Here’s why kurtosis is so important in Data Analysis:
Identifying Tail Risk and Outliers
Kurtosis quantifies the “tailedness” of a distribution, highlighting the frequency and impact of extreme deviations from the mean. High kurtosis (leptokurtic) indicates more frequent and severe outliers, which can be critical in fields like finance. Conversely, low kurtosis (platykurtic) suggests fewer outliers and a more consistent dataset, valuable in quality control and manufacturing.
Enhancing Data Interpretation
While measures like mean and variance provide a basic summary, kurtosis adds depth by revealing whether the data is prone to rare, significant events. This helps analysts move beyond averages to understand the true variability and potential risks within their data.
Supporting Decision-Making
In practical applications, kurtosis informs risk management strategies, policy development, and operational adjustments. For example, a financial analyst may use kurtosis to refine models that predict market crashes, while a manufacturer may monitor kurtosis to detect subtle shifts in product quality before defects become widespread.
Complementing Other Statistical Measures
Kurtosis works alongside skewness (which measures asymmetry) to provide a more complete picture of a distribution’s shape. This is crucial for building accurate statistical models, as both outliers (kurtosis) and asymmetry (skewness) can significantly affect results.
Refining Statistical Models
Many statistical tests assume data is normally distributed, but high kurtosis signals that extreme values are more likely than expected under normality. Incorporating kurtosis into model diagnostics helps analysts choose appropriate methods and avoid underestimating the probability of rare events.
Real-World Impact
In finance, high kurtosis warns of “fat tails,” meaning extreme gains or losses are more probable, directly influencing investment strategies and risk controls. In manufacturing, monitoring kurtosis helps maintain product quality and consistency by identifying when processes produce too many outliers. Healthcare, kurtosis can reveal unusual patient outcomes, guiding personalized interventions.
Kurtosis vs Skewness

Understanding kurtosis and skewness is essential for interpreting the shape and characteristics of data distributions. While both are moments of a distribution and provide insights beyond mean and variance, they describe fundamentally different aspects.
Key Differences
Skewness tells you about the direction and extent of asymmetry in your data. A positive skew means a longer right tail, while a negative skew means a longer left tail. Zero skewness indicates perfect symmetry.
Kurtosis measures how much of the data is in the tails and how sharp or flat the peak is. High kurtosis (leptokurtic) means more data in the tails and a sharper peak, suggesting frequent outliers. Low kurtosis (platykurtic) means flatter peaks and thinner tails, indicating fewer outliers.
“Skewness measures the degree of asymmetry of the distribution, while Kurtosis measures the degree of peakedness and flatness of a distribution.”
Practical Implications
Skewness can affect the mean and median, influencing how representative these measures are for your data.
Kurtosis is crucial for identifying the likelihood of extreme values, which is particularly important in risk assessment and quality control.
In summary, while both skewness and kurtosis in statistics provide valuable insights into the shape of a distribution, skewness focuses on symmetry, and kurtosis focuses on the propensity for outliers and the extremity of data values.
Real-World Applications of Kurtosis

Kurtosis in statistics is widely used across various industries to assess the likelihood and impact of extreme events, making it a critical measure for risk management and decision-making.
Finance and Investment Analysis
In finance, kurtosis is crucial for evaluating the risk of extreme returns in investment portfolios. High kurtosis signals a greater probability of significant deviations from the mean, meaning investments are more likely to experience sudden, large gains or losses.
This is especially relevant for stocks and cryptocurrencies, which often display leptokurtic (high kurtosis) distributions with frequent extreme price swings.
Algorithmic and Quantitative Trading
Quantitative analysts and algorithmic traders use kurtosis to quantify tail risk, ensuring their trading strategies are robust against unexpected market events. Ignoring kurtosis can lead to underestimating the risk of rare but impactful outcomes, potentially resulting in significant financial losses.
Economics and Real Estate
In economics, kurtosis helps measure the risk of extreme events such as market crashes or housing price bubbles. Real estate returns, influenced by infrequent large transactions, often exhibit fat tails, making kurtosis a valuable metric for understanding market volatility and planning investments.
Healthcare and Epidemiology
Kurtosis is applied to identify abnormal patterns in medical data, such as unusual spikes in patient recovery times or rare disease outbreaks. Recognizing these outliers can prompt further investigation or early intervention, improving patient outcomes.
Manufacturing and Quality Control
In manufacturing, kurtosis helps monitor the consistency of production processes. Low kurtosis indicates stable, predictable output with fewer defects, while high kurtosis may signal process issues that need attention to prevent costly errors.
Conclusion
Kurtosis is a powerful lens for understanding data beyond averages and variances. By quantifying tail risk, it enables better decision-making in fields ranging from finance to public health. As data grows in complexity, integrating kurtosis into analytical workflows will remain essential for accurate modeling and risk mitigation.
Frequently Asked Questions
What Is Kurtosis in Simple Terms?
Kurtosis measures whether data’s extreme values (tails) are heavier or lighter than a normal distribution, indicating outlier frequency.
How Is Kurtosis Different from Skewness?
Skewness quantifies asymmetry, while kurtosis focuses on tail thickness. A dataset can be symmetric (no skew) but have high kurtosis.
What Does Negative Kurtosis Mean?
Negative excess kurtosis (platykurtic) implies fewer outliers, like human height data, where extreme values are rare.
Can Kurtosis Be Negative?
Yes, excess kurtosis subtracts 3, so platykurtic distributions have negative values.
Why Is Kurtosis Important in Finance?
High kurtosis in returns suggests frequent extreme price movements, affecting risk models and investment strategies.
Authors
-

Written by:
Versha RawatReviewed by: