Summary: CAGR (Compound Annual Growth Rate) measures average annual growth with compounding. This blog explains how to calculate CAGR in Excel using formulas and the POWER function, practical applications, formatting tips, and common mistakes to avoid.
Introduction
Understanding how investments or business metrics grow over time is crucial for making informed financial decisions. The Compound Annual Growth Rate (CAGR) is one of the most reliable metrics to measure average annual growth, smoothing out fluctuations and reflecting the compounding effect. Excel, with its powerful functions, offers an easy way to calculate CAGR accurately and efficiently.
This blog will guide you through the concept of CAGR, the formula, how to calculate it in Excel using the POWER function, formatting tips, practical use cases, common mistakes to avoid, and more.
Key Takeaways
- CAGR measures average annual growth considering compounding effects.
- Use Excel’s formula (Ending/Beginning)^(1/Periods)-1 to calculate CAGR.
- The POWER function offers an alternative, clear way to compute CAGR.
- Always format CAGR as a percentage for better readability.
- Avoid common mistakes like inconsistent periods and zero values.
What is CAGR (Compound Annual Growth Rate)?
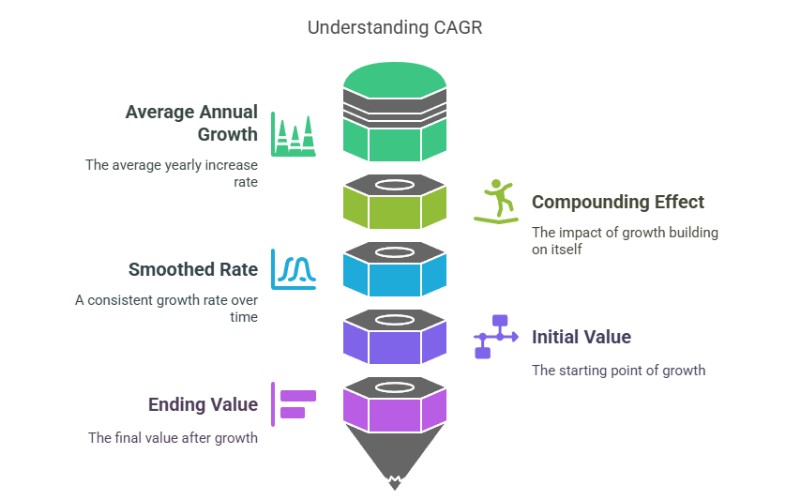
Compound Annual Growth Rate (CAGR) is the average annual growth rate of an investment or metric over a specified period, assuming the growth compounds year over year. Unlike simple averages, CAGR accounts for the effect of compounding, providing a smoothed rate that represents the consistent growth rate needed to move from the initial value to the ending value over the time period.
Why Use CAGR?
- It smooths out volatility and irregular growth.
- Provides a single growth rate for easy comparison.
- Helps compare different investments or business metrics over time.
- Useful for forecasting and performance evaluation.
CAGR Formula
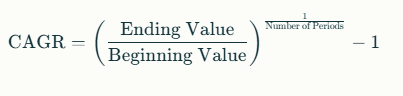
The standard formula for CAGR is:
Where:
- Ending Value = Value at the end of the period
- Beginning Value = Value at the start of the period
- Number of Periods = Total number of years (or compounding periods)
The CAGR Formula in Excel
In Excel, you can calculate CAGR by directly applying the formula. Suppose:
- Beginning value is in cell B2
- Ending value is in cell B3
- Number of years (periods) is in cell B4
The formula to calculate CAGR in Excel is

This formula divides the ending value by the beginning value, raises it to the power of the reciprocal of the number of years, and subtracts 1 to get the growth rate.
Using the POWER Function to Calculate CAGR
Excel’s POWER function can also be used to calculate CAGR, which might be clearer for some users. The syntax for POWER is:

Using the same cell references as above, the CAGR formula with POWER is:

This performs the same calculation: raising the ratio of ending to beginning value to the power of 1 divided by the number of periods, then subtracting 1.
Formatting CAGR as a Percentage
By default, Excel returns CAGR as a decimal. To make it more understandable:
- Select the cell with the CAGR formula.
- Right-click and choose Format Cells.
- Select Percentage and set the desired number of decimal places (usually 2).
- Click OK.
This will display CAGR as a percentage, e.g., 0.102 as 10.20%, which is easier to interpret.
Practical Use Cases of CAGR in Excel

Calculating the Compound Annual Growth Rate (CAGR) in Excel is highly valuable across various fields, especially finance, business analysis, and investment planning. Here are some practical scenarios where CAGR plays a crucial role and how Excel makes it easy to apply:
Investment Performance Analysis
Investors use CAGR to evaluate the average annual return of stocks, mutual funds, or portfolios over multiple years. It smooths out the volatility of yearly returns, providing a clear picture of growth.
For example, if you invested $5,000 in a stock and it grew to $7,500 over 5 years, you can calculate the CAGR in Excel using:

This yields an average annual growth rate of approximately 8.45%, helping investors compare different investment options effectively.
Business Revenue and Profit Growth
Companies track their revenue or profit growth over time to assess business health and performance trends.
Suppose a business’s revenue increased from $200,000 to $315,000 over 3 years. Using Excel, you can calculate CAGR as:
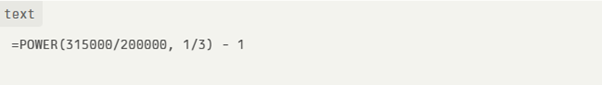
This indicates a 16.61% average annual growth rate, which helps management evaluate growth strategies and benchmark against competitors.
Forecasting Future Growth
CAGR can be used to project future values based on historical growth rates.
If you know the CAGR of sales over the past years, you can forecast sales for upcoming years by applying the CAGR formula in Excel iteratively or using:

This helps in budgeting, planning, and setting realistic targets.
Comparing Different Investments or Business Units
When comparing multiple investments or business units with different durations, CAGR standardizes growth rates for a fair comparison.
By calculating CAGR for each investment or unit in Excel, you can identify which performed better on an annualized basis, regardless of the investment period length.
Evaluating Market or Industry Growth
Analysts use CAGR to measure the growth of market size, customer base, or industry revenues over time.
For example, tracking the growth of a market segment from $50 million to $100 million in 4 years using Excel’s CAGR formula provides insights into market trends and investment opportunities
Tips and Common Mistakes to Avoid When Calculating CAGR in Excel
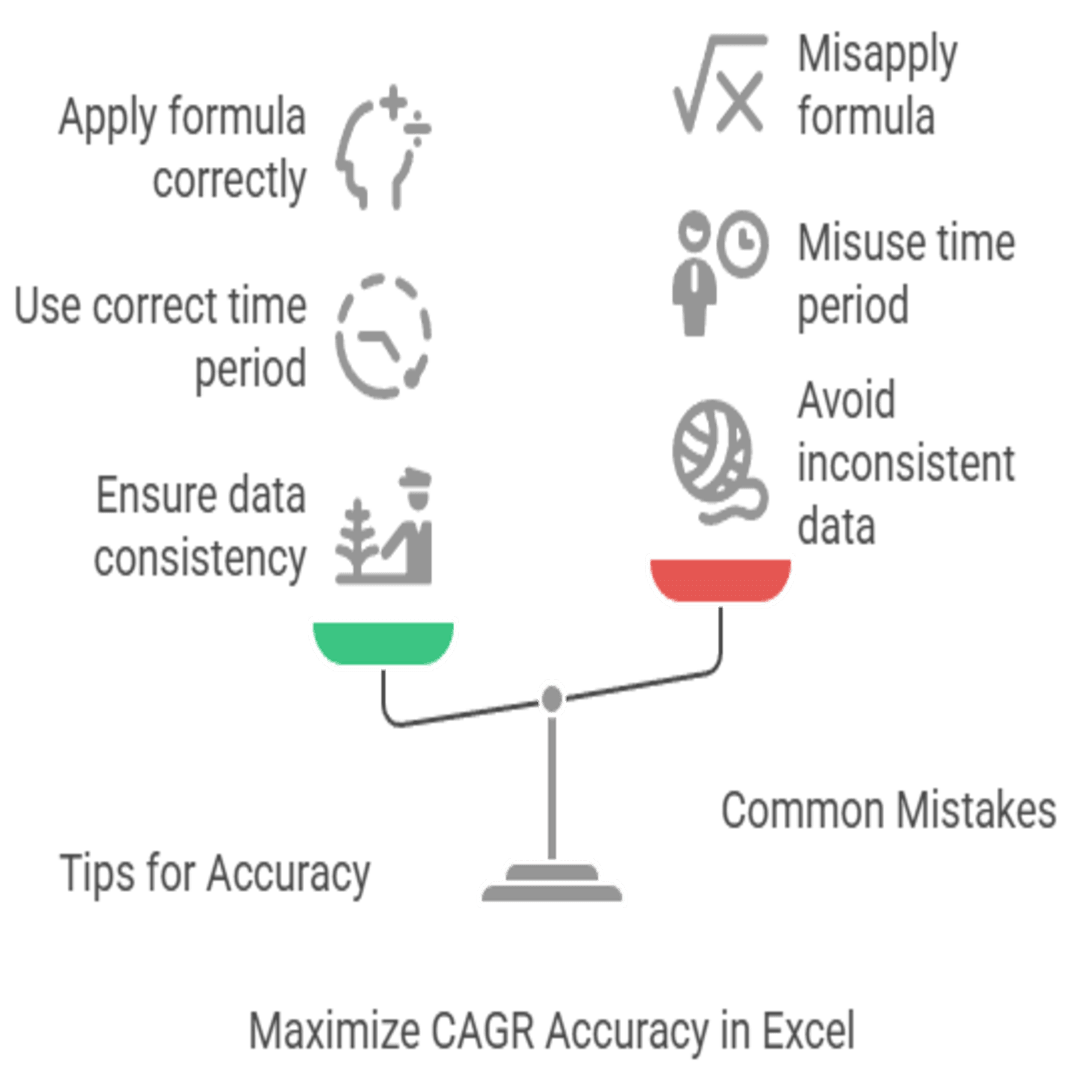
Calculating the Compound Annual Growth Rate (CAGR) in Excel is straightforward, but several common pitfalls can lead to inaccurate or misleading results. Understanding these tips and mistakes will help you use CAGR effectively and interpret the results correctly.
Tips for Accurate CAGR Calculation
- Use Consistent Time Periods: Ensure the number of periods (years, months) matches the data’s time frame. For example, if your data spans from 2010 to 2016, count the full years correctly (usually 6 years minus 1 = 5 periods).
- Include Reinvested Dividends or Returns: When calculating investment growth, factor in dividends or additional returns reinvested during the period to get a true reflection of growth.
- Format Results as Percentages: After calculating CAGR, format the cell as a percentage with two decimal places for better readability and interpretation.
- Use Excel Functions for Accuracy: Use Excel’s POWER() or RATE() functions to calculate CAGR precisely, reducing manual errors.
- Double-Check Data Inputs: Verify that beginning and ending values are positive and correctly inputted. Negative or zero values can cause errors or misleading results.
Common Mistakes to Avoid
- Ignoring the Time Period: One of the most frequent mistakes is miscounting the number of periods. Using an incorrect time frame can drastically distort CAGR. For example, calculating CAGR over a few months as if it were years inflates the growth rate.
- Not Accounting for Fees and Expenses: Calculating CAGR based on gross returns without subtracting fees, taxes, or expenses leads to overestimated growth. Always use net returns for realistic results.
- Assuming Constant Growth: CAGR assumes a steady growth rate, which may mask volatility or fluctuations in actual performance. Avoid extrapolating CAGR indefinitely into the future.
- Using Negative or Zero Values: If the beginning or ending value is zero or negative, Excel may show errors like #NUM!. Ensure values are positive and meaningful for CAGR calculations.
- Overlooking Compounding Frequency: CAGR assumes annual compounding. If your data compounds monthly or quarterly, adjust the number of periods accordingly or convert to annual terms.
Conclusion
CAGR is a vital metric for accurately measuring growth over time, smoothing out fluctuations and reflecting the compounding effect. Excel’s straightforward formulas and functions like POWER make calculating CAGR easy and accessible. Whether you are analysing investments, business metrics, or forecasting future growth, mastering CAGR in Excel empowers you to make informed, data-driven decisions.
Frequently Asked Questions
Can CAGR be Negative?
Yes, CAGR can be negative if the ending value is less than the beginning value, indicating a decline or negative growth over the period.
Is CAGR The Same as Average Annual Return?
No, CAGR smooths growth assuming compounding, while average annual return is a simple arithmetic mean that may not reflect compounding effects.
How Do I Calculate CAGR For Monthly Data in Excel?
Adjust the number of periods to months and convert it to years by dividing by 12 in the formula:
=POWER(Ending/Beginning, 1/(Months/12)) – 1
Authors
-

Written by:
Versha RawatReviewed by: