Summary: Master the SUBTOTAL formula in Excel for smarter data analysis. This guide explains why it’s better than SUM for filtered lists, detailing its syntax and function numbers. Learn practical examples for accurate reporting and how to avoid common pitfalls like double-counting, ensuring your summaries are always correct.
Introduction
In the world of Excel, calculating totals is a fundamental task. While the SUM function is often the go-to for this, a more powerful and versatile tool lies in the SUBTOTAL formula in Excel. This dynamic function offers a smarter way to summarize your data, especially when dealing with filtered or hidden rows.
If you have ever found yourself frustrated with incorrect totals in a filtered list, the SUBTOTAL function is the solution you’ve been looking for.
Key Takeaways
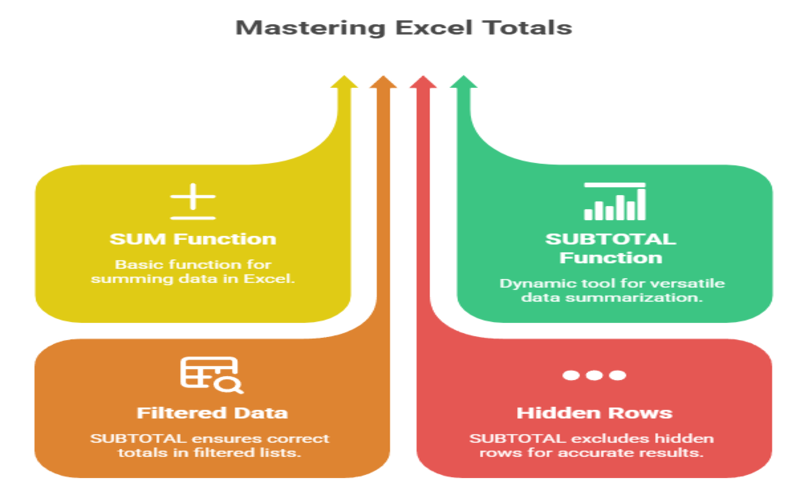
- Use SUBTOTAL for accurate calculations on filtered or hidden data.
- The formula smartly ignores other subtotals, preventing double-counting errors.
- Function 9 sums filtered data; 109 also excludes manually hidden rows.
- SUBTOTAL is far more versatile and dynamic than the basic SUM.
- It’s the best way to create accurate grand totals for reports.
Why Use SUBTOTAL Instead of SUM?

The primary advantage of the SUBTOTAL formula in Excel is its ability to work with visible cells only. When you filter a dataset, the SUM function continues to include all values in its calculation, including those in the hidden rows, which can lead to inaccurate results.
In contrast, the SUBTOTAL function intelligently recalculates to only include the data that is currently visible after a filter is applied.
Furthermore, SUBTOTAL is designed to ignore other SUBTOTAL formulas within its range, preventing the common error of double-counting when you have subtotals and a grand total in the same column. This makes it an indispensable tool for creating accurate and dynamic reports.
Basic Syntax of the SUBTOTAL Function
The syntax for the SUBTOTAL function is straightforward:
=SUBTOTAL(function_num, ref1, [ref2], …)
- function_num: This is a required numerical argument that specifies which function to use for the subtotal (e.g., SUM, AVERAGE, COUNT).
- ref1: This is the first required range of cells you want to subtotal.
- [ref2], …: These are optional additional ranges of cells you want to include in your calculation, up to 254 ranges
Difference Between SUBTOTAL and SUM
The core difference lies in their handling of filtered and hidden data. Here’s a quick comparison:
| Feature | SUM | SUBTOTAL |
| Filtered Rows | Includes all rows, visible or not. | Ignores filtered (hidden) rows by default. |
| Manually Hidden Rows | Includes manually hidden rows. | Can be configured to include or exclude manually hidden rows. |
| Nested Subtotals | Includes other SUM or SUBTOTAL formulas in its range. | Ignores other SUBTOTAL formulas to prevent double-counting |
| Functionality | Only performs addition. | Can perform various calculations like SUM, AVERAGE, COUNT, MAX, MIN, etc. |
In essence, SUM is for a straightforward, static total, while SUBTOTAL provides a dynamic and adaptable summary that responds to changes in your data’s visibility.
Most Common Uses of SUBTOTAL
Discover how the SUBTOTAL function enhances Excel data analysis with its versatile uses. This section explores the most common applications of SUBTOTAL, including dynamic summaries for filtered data, avoiding double counting, and flexible aggregation, empowering you to create accurate, efficient, and adaptable reports effortlessly.
Analyzing Filtered Data
This is the most common and powerful use. When you apply filters to your data, SUBTOTAL ensures your summary calculations (like total sales for a specific region) are always accurate for the visible data.
Creating Reports with Subtotals and Grand Totals
When you have a list with subtotals for different categories and a grand total at the end, using SUBTOTAL for all calculations prevents the grand total from incorrectly adding up the subtotal values.
Working with Excel Tables
Excel’s table feature often uses the SUBTOTAL function in its total row, allowing for dynamic calculations as you filter the table data.
Building Interactive Dashboards
SUBTOTAL is excellent for creating interactive dashboards where users can filter data and see the summary metrics update in real-time.
Function Numbers for SUBTOTAL
The function_num argument is what gives SUBTOTAL its power. There are two sets of function numbers you can use:
| Function | Include Hidden Rows (1-11) | Exclude Hidden Rows (101-111) |
| AVERAGE | 1 | 101 |
| COUNT | 2 | 102 |
| COUNTA | 3 | 103 |
| MAX | 4 | 104 |
| MIN | 5 | 105 |
| PRODUCT | 6 | 106 |
| STDEV | 7 | 107 |
| STDEVP | 8 | 108 |
| SUM | 9 | 109 |
| VAR | 10 | 110 |
| VARP | 11 | 111 |
The key difference between the two sets is how they handle rows that you have manually hidden (by right-clicking and selecting “Hide”).Both sets will always exclude rows hidden by a filter.
- 1-11: Includes values in manually hidden rows.
- 101-111: Excludes values in manually hidden rows, providing a true “what you see is what you get” calculation.
Practical Examples of SUBTOTAL in Excel
Let’s consider a sales data table with columns for ‘Region’, ‘Product’, and ‘Sales’.
Example 1: Summing Filtered Data
Imagine you want to see the total sales for the “North” region.
- Apply a filter to your data range.
- In the ‘Region’ column filter, select “North”.
- In a cell where you want the total, enter the formula: =SUBTOTAL(9, C2:C100) (assuming sales data is in C2:C100).
The result will be the sum of sales for only the “North” region. If you change the filter to “South”, the SUBTOTAL will automatically update.
Example 2: Counting Visible Rows
To count the number of sales transactions visible after filtering for a specific product:
- Apply a filter to the ‘Product’ column.
- Use the formula: =SUBTOTAL(2, C2:C100)
This will give you a count of the visible sales entries.
Example 3: Excluding Manually Hidden Rows
If you have manually hidden some rows and want to calculate the average of only the visible cells, use the 101-111 series of function numbers.
=SUBTOTAL(101, C2:C100)
This will calculate the average of the visible cells, ignoring both filtered and manually hidden rows.
Limitations of SUBTOTAL
While powerful for filtering scenarios, SUBTOTAL has specific constraints related to the scope of its calculations, the functions supported, and behavior with hidden data. For more complex data analysis, complement SUBTOTAL with Pivot Tables or other functions.
Horizontal Ranges
The function is designed to work with vertical data (columns). When used on a horizontal range, it will not exclude values in hidden columns.
3D References
It does not support 3D references, which are references to the same cell or range across multiple worksheets.
Array Formulas
SUBTOTAL does not work directly within array formulas in the way some other functions do. For more complex scenarios, the AGGREGATE function might be a better choice.
Error Values
The SUBTOTAL function can be affected by error values within the specified range.
Tips for Using SUBTOTAL Effectively

Unlock the full potential of your Excel reports by mastering the SUBTOTAL function. This section highlights practical tips and best practices for using SUBTOTAL effectively, helping you analyze filtered data, avoid common pitfalls, and create dynamic summaries for smarter and more efficient spreadsheet work.
Use Excel Tables
Converting your data range to an Excel Table (Ctrl+T) and enabling the “Total Row” will automatically insert SUBTOTAL formulas for you.
Sort Your Data First
When using the automatic subtotal feature (Data tab > Subtotal), ensure your data is sorted by the column you want to group by.
Combine with Other Functions
SUBTOTAL can be nested within other functions like IF to create more complex and conditional calculations.
Remember the Function Numbers
While you don’t need to memorize them all, knowing that 9 is for SUM and 109 is for SUM of visible cells only is a great starting point.
Frequently Asked Questions
What is the SUBTOTAL formula in Excel?
The SUBTOTAL formula in Excel is a versatile function that calculates a subtotal for a range of cells.It can perform various operations like SUM, AVERAGE, and COUNT, and it has the unique ability to include or exclude hidden and filtered cells from the calculation.
How does the SUBTOTAL formula work?
The SUBTOTAL formula works by applying a specified mathematical function (indicated by a function number) to a range of cells. Its key feature is that it can dynamically adjust the calculation to only include visible cells when a filter is applied.
Why use SUBTOTAL instead of SUM in Excel?
You should use SUBTOTAL instead of SUM when you are working with filtered data or when you have subtotals within your data set. SUBTOTAL will give you accurate results for visible cells only and will ignore other SUBTOTAL formulas, preventing double-counting.
How do you subtotal filtered rows in Excel?
To subtotal filtered rows, use the SUBTOTAL function. For example, to sum a filtered column, you would use the formula =SUBTOTAL(9, range). The function will automatically ignore the rows that are hidden by the filter.
What is the difference between SUBTOTAL 9 and 109?
Both SUBTOTAL(9, …) and SUBTOTAL(109, …) calculate the sum of a range. The difference is in how they treat manually hidden rows. SUBTOTAL 9 includes manually hidden rows in its calculation, while SUBTOTAL 109 excludes them. Both will exclude rows hidden by a filter.
In conclusion
Mastering the subtotal formula in Excel is a significant step towards more sophisticated and accurate data analysis. By understanding its syntax, appreciating its advantages over the standard SUM function, and learning to leverage its various function numbers, you can create more dynamic, reliable, and user-friendly spreadsheets.
While there are some limitations, for the vast majority of summary tasks involving filtered or grouped data, SUBTOTAL is the superior choice.
For those dealing with highly specialized or industry-specific data calculations that may push the boundaries of standard Excel functions, exploring dedicated data analysis tools or industry-specific software add-ins could provide even more tailored solutions.
Authors
-

Written by:
Neha SinghReviewed by: