Summary: Unlock the potential of A/B testing in Data Science for evidence-based decisions. Compare variations, measure impact, and refine strategies. This powerful tool empowers businesses to analyze user behavior, optimize product features, and elevate performance, ensuring informed choices in a competitive landscape.
Introduction
A/B testing, or split testing, is a cornerstone for making informed decisions and optimizing outcomes. It involves comparing a variable’s versions—A and B—to discern which performs better.
This method allows organizations to make informed choices based on real-world data rather than assumptions. By systematically testing variations and measuring their impact on user behavior or outcomes, businesses can refine strategies, enhance user experiences, and ultimately boost performance.
This comprehensive guide is tailored for Data Scientists and offers insights into the intricacies of A/B testing using Python. Let’s dive into the must-know aspects of A/B testing, empowering you to harness its potential for data-driven success.
Understanding A/B Testing
A/B testing, or split testing, is a powerful statistical method that compares two variable versions to determine which performs better. It is essential for optimizing performance and making data-driven decisions in Data Analytics and Machine Learning.
This technique involves testing two variations—the control group (A) and the treatment group (B)—to see which version yields superior results.
What is A/B Testing in Data Analytics?
In Data Analytics, A/B testing is commonly used to compare user engagement, conversion rates, or other key metrics between two groups. By creating two versions of a variable, such as a website layout or an advertisement, analysts can measure which version leads to higher engagement or conversions.
The results from the A/B testing dataset help identify the most effective approach and guide future strategies.
What is A/B Testing in Machine Learning?
In Machine Learning, A/B testing plays a crucial role in evaluating the performance of algorithms or models. For instance, you might test two algorithms for better accuracy or efficiency. This method enables Data Scientists to validate hypotheses, fine-tune models, and improve the overall performance of Machine Learning systems.
How A/B Testing Work?
A/B testing involves dividing your audience or dataset into two groups: the control group, which experiences the original version, and the treatment group, which interacts with the new version.
By comparing the outcomes from both groups, you can assess the impact of changes on your key metrics. This approach ensures that decisions are based on empirical evidence rather than assumptions.
Setting Up A/B Testing in Python
Before running an A/B test, you must set up a structured workflow in Python. This includes importing the right libraries and ensuring the dataset is clean and ready for analysis. A well-prepared dataset minimises errors and provides accurate results. Let’s go through the essential steps.
Required Python Libraries
To conduct A/B testing in Python, you need key libraries that help with data handling, statistical analysis, and visualisation.
- Pandas: This library is essential for data manipulation. It allows you to load, clean, and transform datasets efficiently.
- NumPy: It provides numerical computing capabilities, making calculations faster and more efficient.
- SciPy: This library includes statistical functions for hypothesis testing, such as t-tests and chi-square tests.
- Statsmodels: It offers advanced statistical models, making it helpful in analysing A/B test results.
- Matplotlib and Seaborn: These libraries help visualize data distributions, making understanding trends and test results easier.
To install these libraries, run the following command:

Data Preparation and Cleaning
Once you have the necessary libraries, the next step is to prepare the dataset. Clean and structured data ensures accurate and meaningful A/B test results.
Load the Data
First, import the dataset into a Pandas Data Frame. This could be a CSV file, database table, or API response.

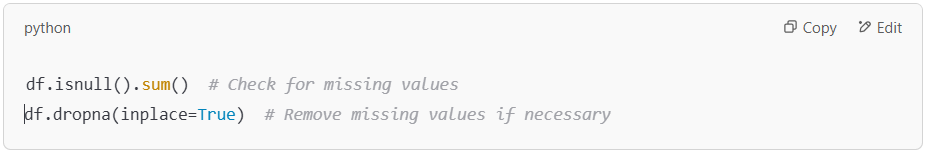
Handle Missing Values
Missing data can skew results. Identify and handle missing values appropriately.
Ensure Data Consistency
Verify that data types are correct and that values make sense. For instance, timestamps should be in the correct format, and categorical values should be consistent.

Remove Duplicates
Duplicate records can bias results. Remove them to maintain data integrity.

Filter Relevant Data
Ensure the dataset includes only necessary observations. For example, exclude inactive users if you are testing a website change.

Following these steps creates a reliable dataset, making your A/B test more accurate and actionable.
Conducting A/B Testing with Python
A/B testing in Python involves implementing statistical tests to compare two variants and drawing meaningful conclusions from the results. By applying methods like the t-test and chi-square test, data scientists can determine whether observed differences are statistically significant. This section covers how to execute these tests in Python and interpret the results effectively.
Implementing Statistical Tests
To analyze A/B test results, we apply statistical tests based on the data type and distribution.
Conducting a t-test in Python
A t-test determines if there is a significant difference between the means of two groups. It is commonly used for evaluating numeric data, such as user engagement metrics or sales revenue.
Steps to perform a t-test in Python:
- Import necessary libraries:

- Define sample data (e.g., conversion rates from Group A and Group B):

- Perform an independent t-test:

If the p-value is below 0.05, the difference is statistically significant, meaning Group B’s performance is likely not due to random chance.
Applying a Chi-Square Test in Python
A chi-square test is used for categorical data, such as click-through rates based on different ad designs. It checks if there is a significant association between two variables.
Steps to perform a chi-square test:
- Import the required library

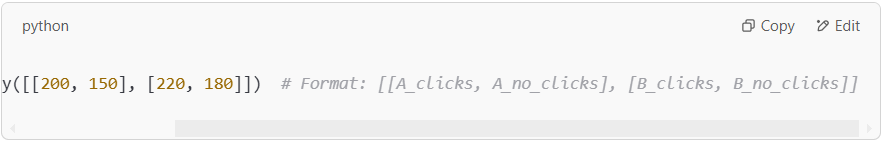
- Create an observed frequency table (e.g., number of clicks vs. no clicks for A/B groups):

- Compute the chi-square statistic:
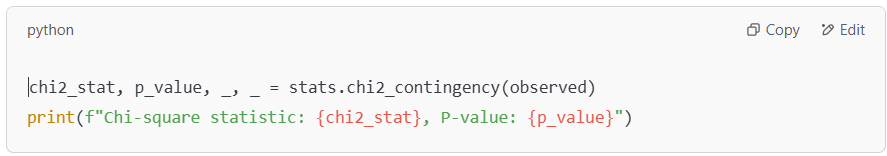
A p-value below 0.05 suggests a significant difference between the two groups.
Analysing Test Results and Interpreting Outcomes
Interpreting A/B test results involves checking statistical significance, confidence intervals, and practical relevance.
- Statistical Significance: If the p-value is below 0.05, the difference between groups is likely real, not random.
- Effect Size: Even if the results are significant, the effect size determines whether the difference is meaningful in a business context.
- Confidence Intervals: A confidence interval helps understand the possible range of outcomes, ensuring the results are reliable.
Data scientists can effectively run A/B tests, derive actionable insights, and make data-driven decisions by following these steps.
Example of Using A/B Testing in Statistics
Consider an e-commerce website aiming to optimise its checkout process. The team decides to conduct an A/B test by introducing a new payment button (B) on the checkout page while keeping the control group’s original button (A). The metric of interest is the conversion rate—the percentage of users completing a purchase.
After a predefined period, the data is collected:
- Control Group (A): 5000 users, 250 conversions (5% conversion rate)
- Treatment Group (B): 5200 users, 300 conversions (5.77% conversion rate)
A two-sample t-test is conducted to analyse statistical significance, resulting in a p-value of 0.03. With a significance level (alpha) set at 0.05, the p-value indicates a statistically significant difference.
Therefore, the team concluded that the new payment button (B) positively impacts the conversion rate, and they decided to implement it site-wide for improved user engagement and revenue.
Example of A/B testing used in a Data Science Project
To understand the application of A/B testing in Data Science, let’s take this example: imagine a mobile app developer seeking to optimise user engagement. The team decides to test a new feature (B) against the existing one (A).
They randomly assign users into two groups and collect data on metrics like user interactions and retention over a month.
Upon analysis, they observe a 15% increase in user engagement for the treatment group (B). Statistical tests, such as a two-sample t-test, yield a p-value below 0.05, indicating significance. This prompts the team to implement the new feature confidently, showcasing the power of data-driven decision-making in enhancing product performance.
Benefits of A/B Testing
A/B testing is a powerful tool for optimizing digital marketing, product development, and user experience. This method relies on an A/B testing dataset to ensure accuracy and reliability in the results. Here are the key benefits:
- Data-Driven Decisions: A/B testing allows businesses to make informed choices based on user behaviour rather than assumptions or guesses.
- Improved Conversion Rates: By identifying which variable version resonates more with users, companies can enhance their conversion rates and achieve better results.
- Enhanced User Experience: Testing different elements helps refine the user experience, leading to higher satisfaction and engagement.
- Cost Efficiency: Instead of investing in broad changes, A/B testing focuses on specific elements, making it a cost-effective strategy for optimisation.
- Faster Results: With clear metrics from the A/B testing dataset, businesses can quickly determine which changes have a positive impact and implement them.
Practical Considerations and Best Practices
Conducting a practical A/B test involves more than just crunching numbers. You must consider several practical aspects to ensure your test yields reliable and actionable insights.
These include the duration of the test, potential biases that might affect the results, and ethical considerations related to how the test is conducted. Implementing best practices is crucial for the validity of your A/B testing dataset.
- Test Duration: Ensure your test runs long enough to collect sufficient data and account for variations in user behaviour. A test that’s too short might not capture enough data to provide accurate results.
- Randomisation: Implement randomisation to eliminate selection bias and ensure that each participant has an equal chance of being assigned to either group. This helps maintain the integrity of your A/B testing dataset.
- Potential Biases: Be mindful of external factors that could skew results. This includes seasonal trends, user demographics, and concurrent marketing campaigns that might influence the outcome.
- Ethical Considerations: Ensure that the test respects participants’ privacy and that any interventions do not cause harm. Transparency with users about the nature of the test can also be crucial.
Wrapping It Up
Mastering A/B testing using Python is a fundamental skill for Data Scientists. This guide provides a roadmap for setting up experiments, formulating hypotheses, assessing statistical significance, and implementing best practices.
With Python’s robust tools and libraries, Data Scientists can unlock the full potential of A/B testing and make informed decisions that drive data-driven success.
If you want to learn in-depth A/B testing in Data Science, you can enroll in the Data Science course with Pickl.AI. As a part of its curriculum, you can learn about the different concepts of Data Science and the tools that will help you become a proficient Data Scientist.
Frequently Asked Questions
What is A/B Testing in Data Analytics?
A/B testing in Data Analytics involves comparing two variable versions to determine which performs better. Businesses can optimise strategies based on real data by analysing user engagement or conversion rates, leading to more effective decision-making.
How is A/B Testing Used in Machine Learning?
In Machine Learning, A/B testing evaluates different algorithms or models to find the most effective one. It helps Data Scientists validate hypotheses and improve model performance by comparing results from control and treatment groups.
What are the Key Benefits of A/B Testing?
A/B testing provides data-driven insights, improves conversion rates, enhances user experience, and offers cost-efficient optimisation. Businesses can make informed decisions that drive performance improvements by analysing a dataset of control and treatment groups.
Authors
-

Written by:
Versha RawatReviewed by: